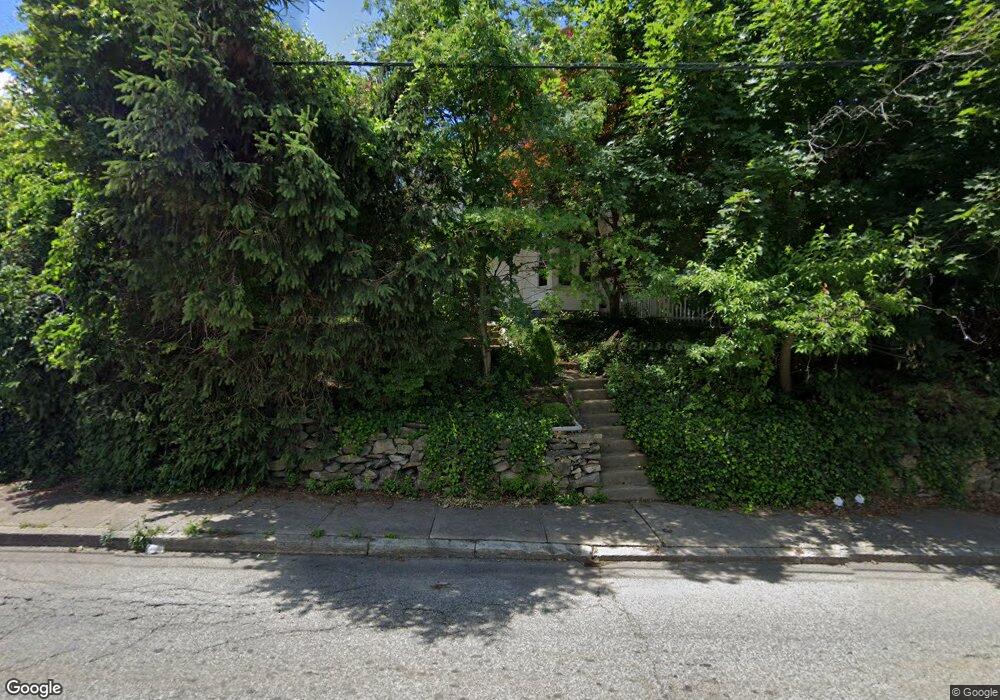
453 Transit St Woonsocket, RI 02895
Globe District NeighborhoodEstimated Value: $350,444 - $377,000
3
Beds
1
Bath
1,214
Sq Ft
$298/Sq Ft
Est. Value
About This Home
This home is located at 453 Transit St, Woonsocket, RI 02895 and is currently estimated at $362,111, approximately $298 per square foot. 453 Transit St is a home located in Providence County with nearby schools including Woonsocket High School, Founders Academy, and Beacon Charter School.
Ownership History
Date
Name
Owned For
Owner Type
Purchase Details
Closed on
Oct 28, 2011
Sold by
Fnma
Bought by
Lacroix Eugene G
Current Estimated Value
Purchase Details
Closed on
May 31, 2011
Sold by
Daigle Denise R
Bought by
Federal National Mortgage Association
Home Financials for this Owner
Home Financials are based on the most recent Mortgage that was taken out on this home.
Original Mortgage
$85,000
Interest Rate
4.94%
Mortgage Type
Purchase Money Mortgage
Purchase Details
Closed on
Jul 15, 2005
Sold by
Parenteay Octave J
Bought by
Daigle Denise R and Daigle Richard A
Purchase Details
Closed on
Jun 24, 1999
Sold by
Wheeler Margaret E
Bought by
Parenteau Octave J and Parenteau Rachel E
Create a Home Valuation Report for This Property
The Home Valuation Report is an in-depth analysis detailing your home's value as well as a comparison with similar homes in the area
Home Values in the Area
Average Home Value in this Area
Purchase History
| Date | Buyer | Sale Price | Title Company |
|---|---|---|---|
| Lacroix Eugene G | $68,500 | -- | |
| Federal National Mortgage Association | $218,709 | -- | |
| Daigle Denise R | $215,000 | -- | |
| Parenteau Octave J | $83,000 | -- | |
| Lacroix Eugene G | $68,500 | -- | |
| Federal National Mortgage Association | $218,709 | -- | |
| Daigle Denise R | $215,000 | -- | |
| Parenteau Octave J | $83,000 | -- |
Source: Public Records
Mortgage History
| Date | Status | Borrower | Loan Amount |
|---|---|---|---|
| Open | Parenteau Octave J | $66,000 | |
| Previous Owner | Parenteau Octave J | $85,000 |
Source: Public Records
Tax History
| Year | Tax Paid | Tax Assessment Tax Assessment Total Assessment is a certain percentage of the fair market value that is determined by local assessors to be the total taxable value of land and additions on the property. | Land | Improvement |
|---|---|---|---|---|
| 2025 | $3,327 | $296,300 | $89,000 | $207,300 |
| 2024 | $3,392 | $233,300 | $90,600 | $142,700 |
| 2023 | $3,262 | $233,300 | $90,600 | $142,700 |
| 2022 | $3,262 | $233,300 | $90,600 | $142,700 |
| 2021 | $2,966 | $124,900 | $36,800 | $88,100 |
| 2020 | $2,998 | $124,900 | $36,800 | $88,100 |
| 2018 | $3,008 | $124,900 | $36,800 | $88,100 |
| 2017 | $3,531 | $117,300 | $40,500 | $76,800 |
| 2016 | $3,735 | $117,300 | $40,500 | $76,800 |
| 2015 | $4,291 | $117,300 | $40,500 | $76,800 |
| 2014 | $4,083 | $113,600 | $44,500 | $69,100 |
Source: Public Records
Map
Nearby Homes
- 1 Admiral St
- 87 Kermit St
- 103 Elmore Ave
- 122 Grand St
- 136 Hemond Ave
- 42 Transit St
- 109 Hemond Ave
- 59 Cooper Ave
- 0 Irving Lot 192 Ave Unit 1383138
- 15 Knight St
- 43 Summit St
- 0 Cranston St
- 184 Avenue C Unit 2
- 184 Avenue C Unit 5
- 184 Avenue C Unit 6
- 184 Avenue C Unit 3
- 184 Avenue C Unit 4
- 184 Avenue C Unit 1
- 0 Laflamme Ave
- 190 Coe St
Your Personal Tour Guide
Ask me questions while you tour the home.