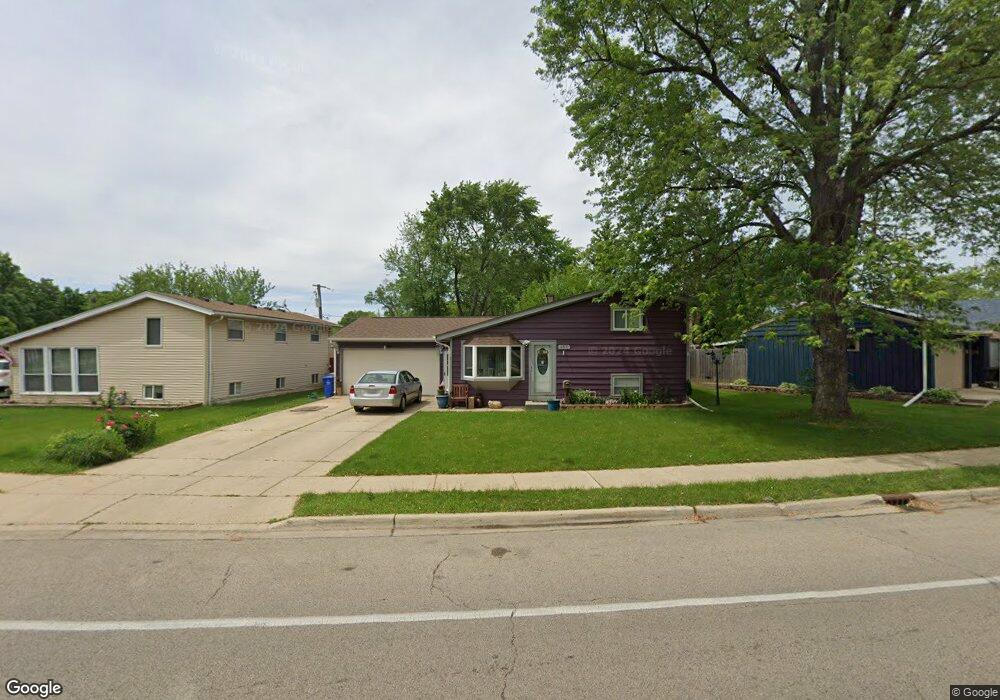
453 Tulsa Ave Carpentersville, IL 60110
Estimated Value: $283,169 - $315,000
3
Beds
1
Bath
1,768
Sq Ft
$167/Sq Ft
Est. Value
About This Home
This home is located at 453 Tulsa Ave, Carpentersville, IL 60110 and is currently estimated at $295,792, approximately $167 per square foot. 453 Tulsa Ave is a home located in Kane County with nearby schools including Lakewood School, Crescent City Grade School, and Carpentersville Middle School.
Ownership History
Date
Name
Owned For
Owner Type
Purchase Details
Closed on
Jul 29, 2011
Sold by
Kissane Ralph E and Lindgren Hollie L
Bought by
Garcia Jesus
Current Estimated Value
Home Financials for this Owner
Home Financials are based on the most recent Mortgage that was taken out on this home.
Original Mortgage
$56,000
Outstanding Balance
$38,701
Interest Rate
4.53%
Mortgage Type
New Conventional
Estimated Equity
$257,091
Purchase Details
Closed on
Aug 27, 1999
Sold by
Chmiola Theodore R
Bought by
Kissane Ralph E and Kissane Holllie L
Home Financials for this Owner
Home Financials are based on the most recent Mortgage that was taken out on this home.
Original Mortgage
$108,794
Interest Rate
7.77%
Mortgage Type
FHA
Create a Home Valuation Report for This Property
The Home Valuation Report is an in-depth analysis detailing your home's value as well as a comparison with similar homes in the area
Home Values in the Area
Average Home Value in this Area
Purchase History
| Date | Buyer | Sale Price | Title Company |
|---|---|---|---|
| Garcia Jesus | $70,000 | Freedom Title Corporation | |
| Kissane Ralph E | $109,000 | Chicago Title Insurance Co |
Source: Public Records
Mortgage History
| Date | Status | Borrower | Loan Amount |
|---|---|---|---|
| Open | Garcia Jesus | $56,000 | |
| Previous Owner | Kissane Ralph E | $108,794 |
Source: Public Records
Tax History Compared to Growth
Tax History
| Year | Tax Paid | Tax Assessment Tax Assessment Total Assessment is a certain percentage of the fair market value that is determined by local assessors to be the total taxable value of land and additions on the property. | Land | Improvement |
|---|---|---|---|---|
| 2024 | $5,055 | $74,750 | $12,553 | $62,197 |
| 2023 | $4,979 | $67,258 | $11,295 | $55,963 |
| 2022 | $4,920 | $62,507 | $11,295 | $51,212 |
| 2021 | $4,803 | $59,019 | $10,665 | $48,354 |
| 2020 | $4,722 | $57,692 | $10,425 | $47,267 |
| 2019 | $4,614 | $54,768 | $9,897 | $44,871 |
| 2018 | $4,379 | $50,125 | $9,701 | $40,424 |
| 2017 | $4,194 | $46,890 | $9,075 | $37,815 |
| 2016 | $3,689 | $39,534 | $8,787 | $30,747 |
| 2015 | -- | $34,957 | $8,234 | $26,723 |
| 2014 | -- | $31,208 | $8,007 | $23,201 |
| 2013 | -- | $32,163 | $8,252 | $23,911 |
Source: Public Records
Map
Nearby Homes
- 1426 Kings Rd
- 140 Hickory Dr
- 105 Siesta Rd
- 103 Hickory Dr
- 200 Amarillo Dr
- 171 Lake Shore Dr
- 7 Austin Ave
- 149 Austin Ave
- 57 Robin Rd
- 4 Austin Ave
- 181 Skyline Dr
- 327 Tulsa Ave
- 308 Amarillo Ct
- 944 Cortney Dr
- 7 Hickory Dr
- 336 Delaware St
- 94 Wren Rd
- 2013 Silverstone Dr Unit 2013
- 1431 Silverstone Dr Unit 1416
- 1040 Rosewood Dr