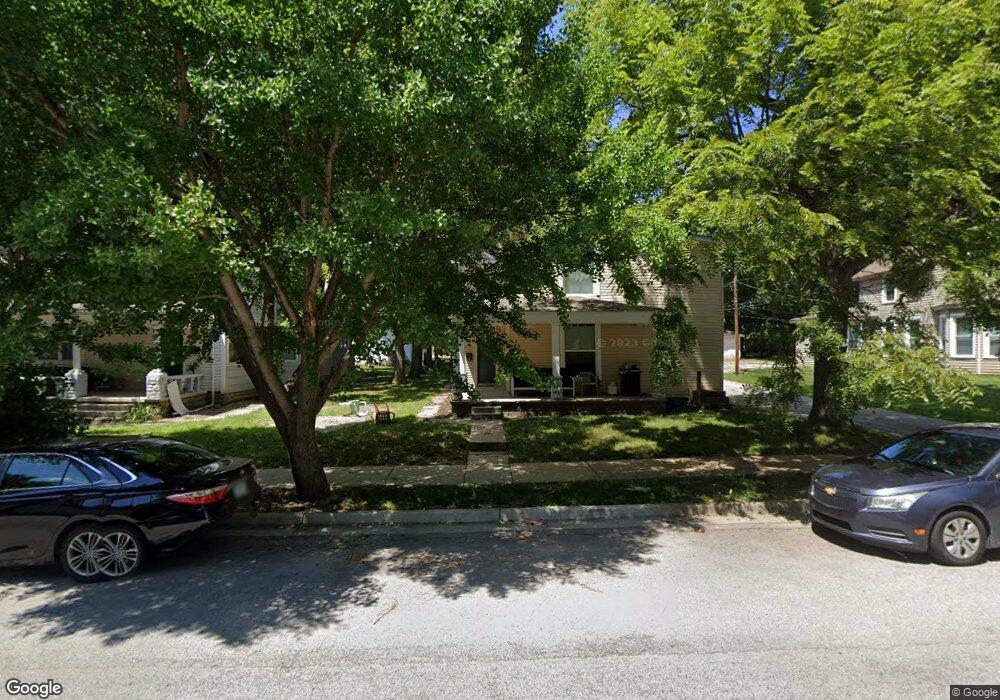
453 Vine St West Lafayette, IN 47906
Estimated Value: $408,000 - $446,000
--
Bed
3
Baths
2,464
Sq Ft
$172/Sq Ft
Est. Value
About This Home
This home is located at 453 Vine St, West Lafayette, IN 47906 and is currently estimated at $423,667, approximately $171 per square foot. 453 Vine St is a home located in Tippecanoe County with nearby schools including West Lafayette Intermediate School, West Lafayette Elementary School, and West Lafayette Junior/Senior High School.
Ownership History
Date
Name
Owned For
Owner Type
Purchase Details
Closed on
Jan 27, 2021
Sold by
Michael J S Lin Trust
Bought by
Lin Holdings Llc
Current Estimated Value
Purchase Details
Closed on
Jul 3, 2019
Sold by
Lin Michael J and Lin Emily J
Bought by
Lin Trust and Lin Trust
Purchase Details
Closed on
Nov 6, 2012
Sold by
Laffayette Savings Bank
Bought by
Lin Michael and Lin Emily
Home Financials for this Owner
Home Financials are based on the most recent Mortgage that was taken out on this home.
Original Mortgage
$148,000
Interest Rate
3.4%
Mortgage Type
Commercial
Purchase Details
Closed on
Jun 18, 2012
Sold by
Regency Properties Llc
Bought by
Regency Properties Llc
Purchase Details
Closed on
Sep 19, 2004
Sold by
Vine Stadium Llc
Bought by
Regency Properties Llc
Create a Home Valuation Report for This Property
The Home Valuation Report is an in-depth analysis detailing your home's value as well as a comparison with similar homes in the area
Home Values in the Area
Average Home Value in this Area
Purchase History
| Date | Buyer | Sale Price | Title Company |
|---|---|---|---|
| Lin Holdings Llc | -- | None Available | |
| Lin Trust | -- | None Available | |
| Lin Michael | -- | None Available | |
| Regency Properties Llc | -- | None Available | |
| Regency Properties Llc | -- | -- |
Source: Public Records
Mortgage History
| Date | Status | Borrower | Loan Amount |
|---|---|---|---|
| Previous Owner | Lin Michael | $148,000 |
Source: Public Records
Tax History Compared to Growth
Tax History
| Year | Tax Paid | Tax Assessment Tax Assessment Total Assessment is a certain percentage of the fair market value that is determined by local assessors to be the total taxable value of land and additions on the property. | Land | Improvement |
|---|---|---|---|---|
| 2024 | $6,034 | $254,600 | $61,000 | $193,600 |
| 2023 | $5,899 | $248,900 | $61,000 | $187,900 |
| 2022 | $5,645 | $238,200 | $61,000 | $177,200 |
| 2021 | $5,382 | $227,100 | $61,000 | $166,100 |
| 2020 | $5,382 | $227,100 | $61,000 | $166,100 |
| 2019 | $5,382 | $227,100 | $61,000 | $166,100 |
| 2018 | $5,200 | $219,400 | $57,500 | $161,900 |
| 2017 | $5,060 | $213,500 | $57,500 | $156,000 |
| 2016 | $4,996 | $210,820 | $57,500 | $153,320 |
| 2014 | $4,766 | $201,100 | $53,000 | $148,100 |
| 2013 | $4,728 | $199,500 | $53,000 | $146,500 |
Source: Public Records
Map
Nearby Homes
- 805 N Chauncey Ave
- 229 Connolly St
- 306 E Stadium Ave
- 238 Connolly St
- 845 Rose St
- 237 E Sunset Ln
- 320 Brown St
- 1220 Ravinia Rd
- 127 Rockland Dr
- 1411 N Salisbury St
- 618 Northridge Dr
- 502 Hillcrest Rd
- 509 Carrolton Blvd
- 701 Carrolton Blvd
- 500 Carrolton Blvd
- 511 N 7th St
- 629 North St
- 1909 Indian Trail Dr
- 1000 Hartford St
- 1912 Indian Trail Dr