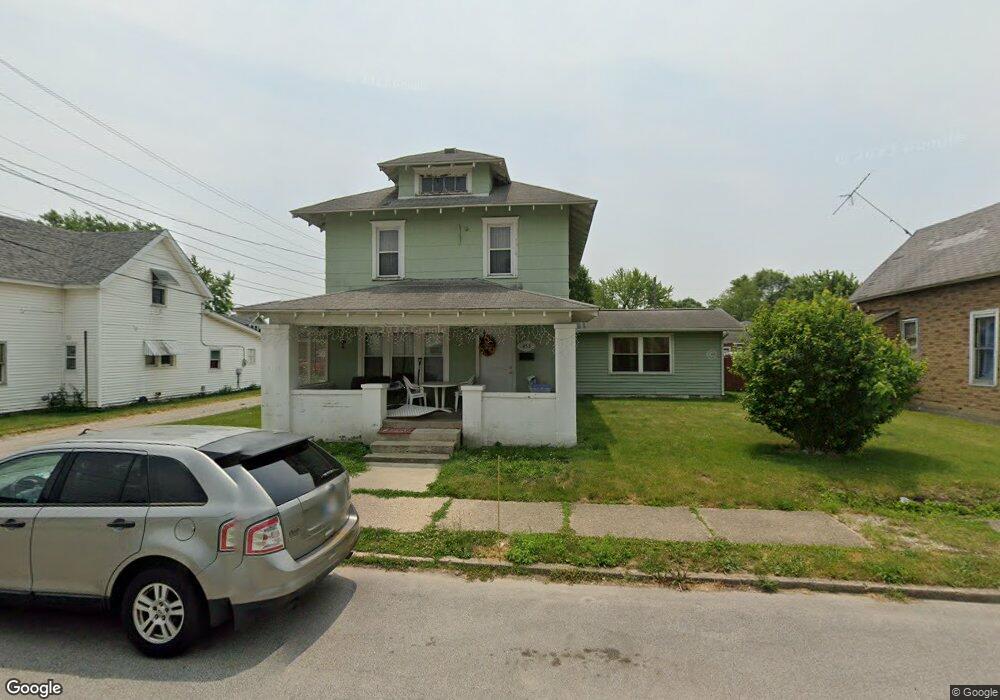
453 W South St Frankfort, IN 46041
Estimated Value: $173,000 - $222,000
3
Beds
1
Bath
1,952
Sq Ft
$96/Sq Ft
Est. Value
About This Home
This home is located at 453 W South St, Frankfort, IN 46041 and is currently estimated at $186,453, approximately $95 per square foot. 453 W South St is a home located in Clinton County with nearby schools including Frankfort Senior High School and Frankfort Covenant Academy.
Ownership History
Date
Name
Owned For
Owner Type
Purchase Details
Closed on
Dec 28, 2005
Sold by
Jacoby Shane J and Jacoby Kimberly
Bought by
Muinozcano Roberto and Celis Hermelinda
Current Estimated Value
Home Financials for this Owner
Home Financials are based on the most recent Mortgage that was taken out on this home.
Original Mortgage
$75,905
Outstanding Balance
$43,193
Interest Rate
6.48%
Mortgage Type
New Conventional
Estimated Equity
$143,260
Purchase Details
Closed on
Jun 19, 1997
Sold by
Anderson Dennis R and Anderson Nancy J
Bought by
Jacoby Shane J and Jacoby Kimberly
Create a Home Valuation Report for This Property
The Home Valuation Report is an in-depth analysis detailing your home's value as well as a comparison with similar homes in the area
Home Values in the Area
Average Home Value in this Area
Purchase History
| Date | Buyer | Sale Price | Title Company |
|---|---|---|---|
| Muinozcano Roberto | -- | None Available | |
| Jacoby Shane J | $62,000 | -- |
Source: Public Records
Mortgage History
| Date | Status | Borrower | Loan Amount |
|---|---|---|---|
| Open | Muinozcano Roberto | $75,905 |
Source: Public Records
Tax History Compared to Growth
Tax History
| Year | Tax Paid | Tax Assessment Tax Assessment Total Assessment is a certain percentage of the fair market value that is determined by local assessors to be the total taxable value of land and additions on the property. | Land | Improvement |
|---|---|---|---|---|
| 2024 | $1,161 | $105,000 | $8,900 | $96,100 |
| 2023 | $1,161 | $105,000 | $8,900 | $96,100 |
| 2022 | $1,171 | $105,900 | $8,900 | $97,000 |
| 2021 | $420 | $53,600 | $8,900 | $44,700 |
| 2020 | $433 | $53,600 | $8,900 | $44,700 |
| 2019 | $457 | $58,700 | $8,900 | $49,800 |
| 2018 | $455 | $58,700 | $8,900 | $49,800 |
| 2017 | $461 | $60,100 | $10,600 | $49,500 |
| 2016 | $430 | $58,600 | $10,600 | $48,000 |
| 2014 | $308 | $62,200 | $10,600 | $51,600 |
Source: Public Records
Map
Nearby Homes
- 359 S 2nd St
- 556 W Boone St
- 358 S Columbia St
- 506 W Walnut St
- 458 S Jackson St
- 652 S Jackson St
- 250 252 W Washington St
- 250 , 252 W Washington St
- 820 Hackberry Ct
- 862 S Jackson St
- 1209 E Wabash St
- 353 Brightwood Dr
- 557 E Boone St
- 708 Glendale Dr
- 401 Knox St
- 1159 W Mcclurg St
- 255 N East St
- 1401 W Morrison St
- 951 W Paris St
- 557 W Green St