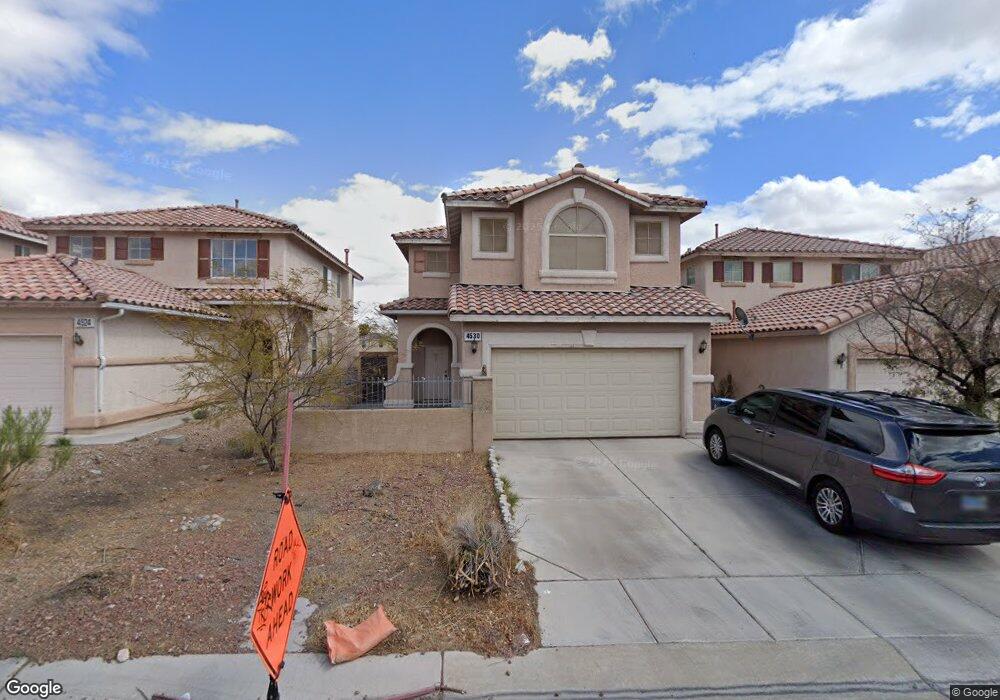
4530 Flaming Ridge Trail Las Vegas, NV 89147
Rancho Viejo NeighborhoodEstimated Value: $472,221 - $515,000
4
Beds
3
Baths
2,024
Sq Ft
$244/Sq Ft
Est. Value
About This Home
This home is located at 4530 Flaming Ridge Trail, Las Vegas, NV 89147 and is currently estimated at $493,055, approximately $243 per square foot. 4530 Flaming Ridge Trail is a home located in Clark County with nearby schools including Keith C. & Karen W. Hayes Elementary School, Clifford J Lawrence Junior High School, and Durango High School.
Ownership History
Date
Name
Owned For
Owner Type
Purchase Details
Closed on
Dec 22, 2010
Sold by
Federal Home Loan Mortgage Corporation
Bought by
Zemedkun Mesfin and Reta Meseret
Current Estimated Value
Home Financials for this Owner
Home Financials are based on the most recent Mortgage that was taken out on this home.
Original Mortgage
$163,300
Outstanding Balance
$107,614
Interest Rate
4.17%
Mortgage Type
FHA
Estimated Equity
$385,441
Purchase Details
Closed on
Sep 10, 2009
Sold by
Farmer Dalton J and Farmer Donna L
Bought by
Federal Home Loan Mortgage Corporation
Purchase Details
Closed on
Aug 24, 2000
Sold by
Kaufman & Broad Of Nevada Inc
Bought by
Farmer Dalton J and Farmer Donna L
Home Financials for this Owner
Home Financials are based on the most recent Mortgage that was taken out on this home.
Original Mortgage
$136,450
Interest Rate
8.2%
Create a Home Valuation Report for This Property
The Home Valuation Report is an in-depth analysis detailing your home's value as well as a comparison with similar homes in the area
Home Values in the Area
Average Home Value in this Area
Purchase History
| Date | Buyer | Sale Price | Title Company |
|---|---|---|---|
| Zemedkun Mesfin | $165,500 | Fidelity National Title T | |
| Federal Home Loan Mortgage Corporation | $166,000 | Fidelity National Default So | |
| Farmer Dalton J | $151,633 | First American Title Co |
Source: Public Records
Mortgage History
| Date | Status | Borrower | Loan Amount |
|---|---|---|---|
| Open | Zemedkun Mesfin | $163,300 | |
| Previous Owner | Farmer Dalton J | $136,450 |
Source: Public Records
Tax History Compared to Growth
Tax History
| Year | Tax Paid | Tax Assessment Tax Assessment Total Assessment is a certain percentage of the fair market value that is determined by local assessors to be the total taxable value of land and additions on the property. | Land | Improvement |
|---|---|---|---|---|
| 2025 | $1,959 | $111,200 | $38,500 | $72,700 |
| 2024 | $1,903 | $111,200 | $38,500 | $72,700 |
| 2023 | $1,903 | $102,027 | $33,250 | $68,777 |
| 2022 | $1,847 | $89,102 | $26,250 | $62,852 |
| 2021 | $1,794 | $84,310 | $24,500 | $59,810 |
| 2020 | $1,738 | $83,829 | $24,500 | $59,329 |
| 2019 | $1,688 | $79,595 | $21,350 | $58,245 |
| 2018 | $1,639 | $72,925 | $17,150 | $55,775 |
| 2017 | $2,129 | $72,577 | $16,100 | $56,477 |
| 2016 | $1,552 | $69,035 | $12,600 | $56,435 |
| 2015 | $1,549 | $53,404 | $9,450 | $43,954 |
| 2014 | $1,503 | $49,735 | $7,350 | $42,385 |
Source: Public Records
Map
Nearby Homes
- 9154 W Naples Dr
- 4512 Long Horse Ct
- 9463 Malasana Ct
- 9496 Los Cotos Ct
- 9037 Alpine Peaks Ave
- 9470 Peace Way Unit 216
- 9470 Peace Way Unit 206
- 9470 Peace Way Unit 134
- 8960 Lansberry Ct
- 9523 Castillana Ct
- 4607 El Camino Cabos Dr
- 8911 Lansberry Ct
- 4326 Spooner Lake Cir
- 8880 Flat Sands Ct
- 4563 Timaru Dr
- 4678 El Camino Cabos Dr
- 9050 W Tropicana Ave Unit 1138
- 9050 W Tropicana Ave Unit 1066
- 9050 W Tropicana Ave Unit 1086
- 9050 W Tropicana Ave Unit 1113
- 4536 Flaming Ridge Trail
- 4524 Flaming Ridge Trail
- 4542 Flaming Ridge Trail
- 4518 Flaming Ridge Trail
- 9247 River Owl Ct
- 4548 Flaming Ridge Trail
- 4512 Flaming Ridge Trail
- 9241 River Owl Ct
- 9261 Cloudberry Ct
- 9248 River Owl Ct
- 4554 Flaming Ridge Trail
- 9235 River Owl Ct
- 9246 Volcanic Cactus Ct
- 4506 Flaming Ridge Trail
- 9269 Cloudberry Ct
- 9260 Cloudberry Ct
- 9240 Volcanic Cactus Ct
- 9262 Eliana Ct
- 9236 River Owl Ct
- 4560 Flaming Ridge Trail