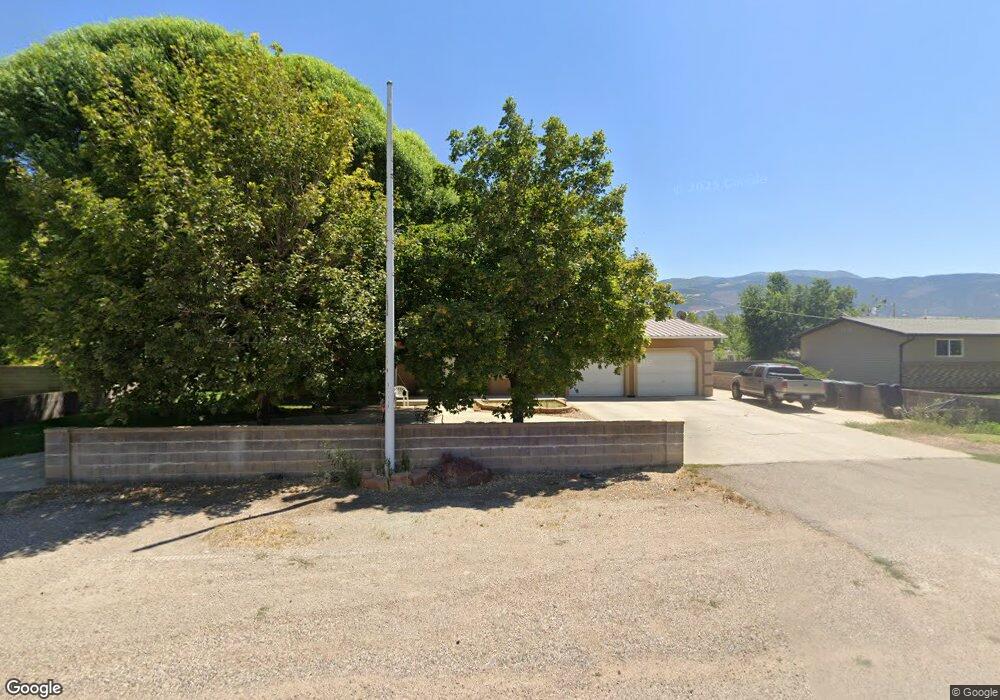
4530 N Magnolia Dr Cedar City, UT 84721
Estimated Value: $381,000 - $402,000
5
Beds
2
Baths
1,920
Sq Ft
$203/Sq Ft
Est. Value
About This Home
This home is located at 4530 N Magnolia Dr, Cedar City, UT 84721 and is currently estimated at $389,995, approximately $203 per square foot. 4530 N Magnolia Dr is a home located in Iron County with nearby schools including Enoch School, Cedar Middle School, and Cedar City High School.
Ownership History
Date
Name
Owned For
Owner Type
Purchase Details
Closed on
Jan 12, 2017
Sold by
Baxter Joshua A
Bought by
Baxter Zurisadai N
Current Estimated Value
Purchase Details
Closed on
Jan 4, 2010
Sold by
U S Bank N A
Bought by
Baxter Joshua A
Home Financials for this Owner
Home Financials are based on the most recent Mortgage that was taken out on this home.
Original Mortgage
$109,183
Outstanding Balance
$71,976
Interest Rate
5.03%
Mortgage Type
New Conventional
Estimated Equity
$318,020
Purchase Details
Closed on
May 2, 2007
Sold by
Mizachi Hayim
Bought by
Eva Properties Llc
Purchase Details
Closed on
Mar 3, 2006
Sold by
Ballard Ophir James and Ballard Beverly J
Bought by
Mizachi Haylm
Home Financials for this Owner
Home Financials are based on the most recent Mortgage that was taken out on this home.
Original Mortgage
$198,400
Interest Rate
6.08%
Mortgage Type
New Conventional
Create a Home Valuation Report for This Property
The Home Valuation Report is an in-depth analysis detailing your home's value as well as a comparison with similar homes in the area
Home Values in the Area
Average Home Value in this Area
Purchase History
| Date | Buyer | Sale Price | Title Company |
|---|---|---|---|
| Baxter Zurisadai N | -- | Accommodation | |
| Baxter Joshua A | -- | -- | |
| Eva Properties Llc | -- | -- | |
| Mizachi Haylm | -- | -- |
Source: Public Records
Mortgage History
| Date | Status | Borrower | Loan Amount |
|---|---|---|---|
| Open | Baxter Joshua A | $109,183 | |
| Previous Owner | Mizachi Haylm | $198,400 |
Source: Public Records
Tax History Compared to Growth
Tax History
| Year | Tax Paid | Tax Assessment Tax Assessment Total Assessment is a certain percentage of the fair market value that is determined by local assessors to be the total taxable value of land and additions on the property. | Land | Improvement |
|---|---|---|---|---|
| 2025 | $1,484 | $203,303 | $45,650 | $157,653 |
| 2023 | $1,503 | $188,050 | $42,860 | $145,190 |
| 2022 | $1,478 | $172,810 | $40,820 | $131,990 |
| 2021 | $1,146 | $134,005 | $24,010 | $109,995 |
| 2020 | $1,194 | $122,620 | $15,825 | $106,795 |
| 2019 | $1,213 | $118,265 | $14,300 | $103,965 |
| 2018 | $1,217 | $115,340 | $14,300 | $101,040 |
| 2017 | $993 | $98,680 | $14,300 | $84,380 |
| 2016 | $948 | $87,730 | $12,130 | $75,600 |
| 2015 | $949 | $83,050 | $0 | $0 |
| 2014 | $969 | $79,710 | $0 | $0 |
Source: Public Records
Map
Nearby Homes
- 723 E Rose Ln
- 4960 N Minersville Hwy
- 4355 N Maple Ln
- 4125 N Minersville Hwy
- 4886 N Springfield Cir Unit lot 13
- 4889 N Springfield Cir Unit lot 15
- 7 Acre Ft 1963 Priority Date
- 4960 N Minersville Hwy Approx
- 4953 N Winchester Dr
- 4509 N Gold Dust Trail St
- 4919 N Matheson Way
- 4961 N Winchester Dr
- 927 E Winchester Dr
- 2700 W Midvalley Rd
- 582 E 5020 N
- 4510 N Magnolia Dr
- 4548 N Magnolia Dr
- 4496 N Magnolia Dr
- 4529 N Magnolia Dr
- 448 E Blue Sky Dr N
- 4509 N Magnolia Dr
- 4549 N Magnolia Dr
- 4493 N Magnolia Dr
- 4480 N Magnolia Dr
- 468 E Blue Sky Dr N
- 4479 N Magnolia Dr
- 421 E Blue Sky Dr N
- 4466 N Magnolia Dr
- 4465 N Apple Blossom Ln
- 445 E Blue Sky Dr N
- 471 E Blue Sky Dr N
- 371 E Blue Sky Dr N
- 4465 N Magnolia Dr
- 516 E Blue Sky Dr N
- 4477 N Apple Blossom Ln