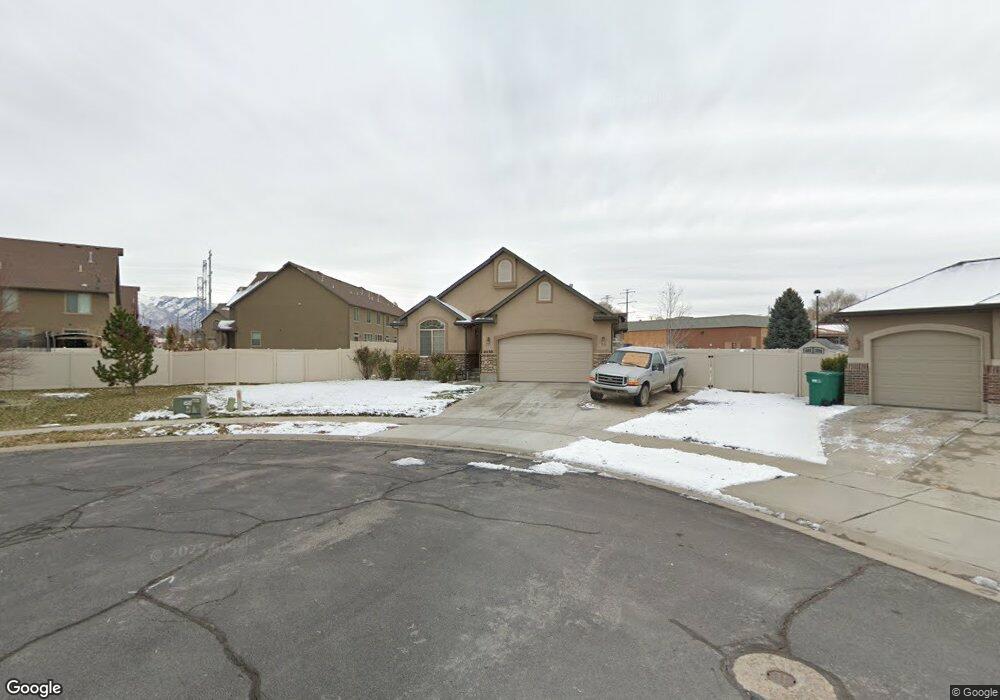
4530 S 3375 W West Haven, UT 84401
Estimated Value: $481,000 - $546,483
3
Beds
2
Baths
2,766
Sq Ft
$183/Sq Ft
Est. Value
About This Home
This home is located at 4530 S 3375 W, West Haven, UT 84401 and is currently estimated at $506,871, approximately $183 per square foot. 4530 S 3375 W is a home located in Weber County with nearby schools including West Haven School, Sand Ridge Junior High School, and Roy High School.
Ownership History
Date
Name
Owned For
Owner Type
Purchase Details
Closed on
Sep 24, 2010
Sold by
Petty Dustin and Petty Angela
Bought by
Ward Colleen O and Ward Duane
Current Estimated Value
Home Financials for this Owner
Home Financials are based on the most recent Mortgage that was taken out on this home.
Original Mortgage
$160,000
Outstanding Balance
$104,792
Interest Rate
4.28%
Mortgage Type
New Conventional
Estimated Equity
$402,079
Purchase Details
Closed on
Jan 16, 2008
Sold by
Petty Dustin and Petty Angela
Bought by
Petty Dustin and Petty Angela
Home Financials for this Owner
Home Financials are based on the most recent Mortgage that was taken out on this home.
Original Mortgage
$233,900
Interest Rate
6.15%
Mortgage Type
Purchase Money Mortgage
Purchase Details
Closed on
Dec 18, 2007
Sold by
Ivory North
Bought by
Petty Dustin and Petty Angela
Home Financials for this Owner
Home Financials are based on the most recent Mortgage that was taken out on this home.
Original Mortgage
$233,900
Interest Rate
6.15%
Mortgage Type
Purchase Money Mortgage
Create a Home Valuation Report for This Property
The Home Valuation Report is an in-depth analysis detailing your home's value as well as a comparison with similar homes in the area
Home Values in the Area
Average Home Value in this Area
Purchase History
| Date | Buyer | Sale Price | Title Company |
|---|---|---|---|
| Ward Colleen O | -- | U S Title | |
| Petty Dustin | -- | Equity Title Layton | |
| Petty Dustin | -- | Cottonwood Title Layton |
Source: Public Records
Mortgage History
| Date | Status | Borrower | Loan Amount |
|---|---|---|---|
| Open | Ward Colleen O | $160,000 | |
| Previous Owner | Petty Dustin | $233,900 |
Source: Public Records
Tax History Compared to Growth
Tax History
| Year | Tax Paid | Tax Assessment Tax Assessment Total Assessment is a certain percentage of the fair market value that is determined by local assessors to be the total taxable value of land and additions on the property. | Land | Improvement |
|---|---|---|---|---|
| 2025 | $3,149 | $512,352 | $169,911 | $342,441 |
| 2024 | $3,044 | $277,199 | $93,451 | $183,748 |
| 2023 | $3,216 | $292,600 | $93,224 | $199,376 |
| 2022 | $3,145 | $294,250 | $87,695 | $206,555 |
| 2021 | $2,670 | $420,000 | $93,375 | $326,625 |
| 2020 | $2,491 | $360,000 | $78,054 | $281,946 |
| 2019 | $2,466 | $337,000 | $71,428 | $265,572 |
| 2018 | $2,454 | $321,000 | $71,428 | $249,572 |
| 2017 | $2,202 | $277,000 | $69,019 | $207,981 |
| 2016 | $1,970 | $132,672 | $31,660 | $101,012 |
| 2015 | $1,756 | $115,313 | $31,660 | $83,653 |
| 2014 | $1,649 | $105,040 | $31,660 | $73,380 |
Source: Public Records
Map
Nearby Homes
- 4491 Haven Creek Rd Unit A
- 4510 Stone Creek Rd Unit F
- 3434 W 4525 S
- 4440 Stone Creek Rd Unit 2E
- 4317 S 3350 W
- 3171 W 4725 S
- Villages Townhome Plan at Green Farm - Villages
- 3652 W 4625 S
- 3632 W 4650 S
- 3627 W 4650 S
- 3669 W 4625 S
- 3692 W 4625 S
- 4357 S 3700 W
- 3671 W 4700 S
- 2979 W 4275 S
- 3524 W 4835 S Unit 22
- 3523 W 4835 S Unit 28
- 4635 S 2950 W
- 3014 W 4750 S
- 4124 S 3560 W
- 3373 W 4525 S
- 4535 Haven Creek Rd
- 4535 Haven Creek Rd Unit C
- 4535 Haven Creek Rd Unit B
- 4535 Haven Creek Rd
- 4535 Haven Creek Rd Unit 13B
- 4518 S 3375 W
- 4511 Haven Creek Rd
- 4511 Haven Creek Rd
- 4511 Haven Creek Rd Unit C
- 4511 Haven Creek Rd Unit B
- 4511 Haven Creek Rd Unit 12B
- 4511 S Haven Creek Rd C S
- 4511 Haven Creek Rd Unit E
- 4511 Haven Creek Rd Unit 12D
- 4511 Haven Creek Rd Unit 12E
- 4511 Haven Creek Rd
- 4511 Haven Creek Rd Unit 12D
- 3391 W 4525 S
- 4512 Haven Creek Rd