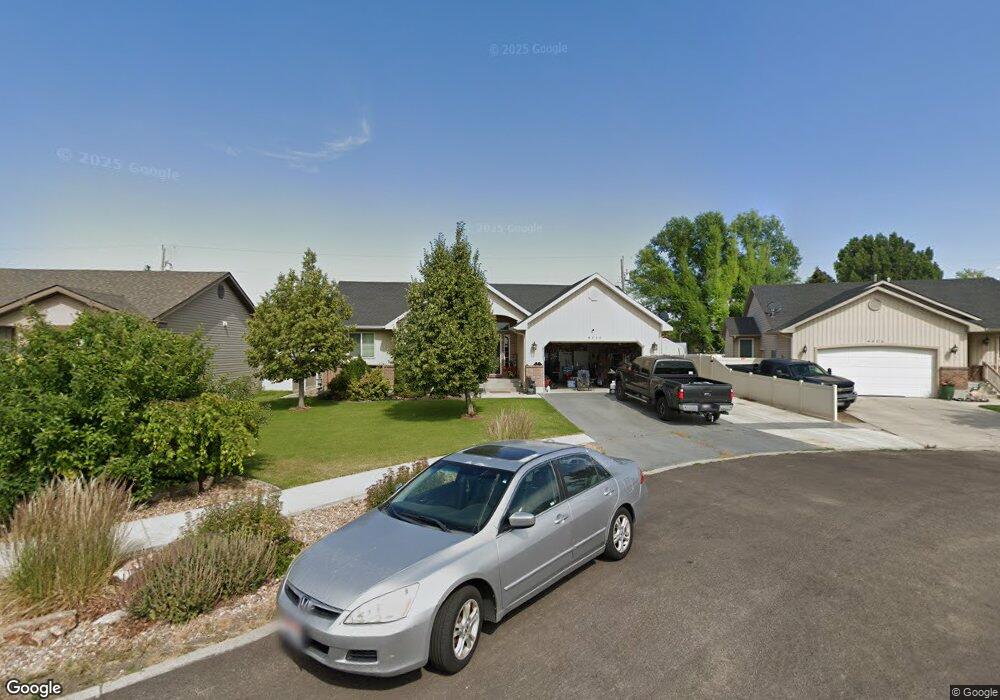
4530 Sarah Loop Pocatello, ID 83202
Estimated Value: $384,000 - $415,000
4
Beds
2
Baths
2,121
Sq Ft
$188/Sq Ft
Est. Value
About This Home
This home is located at 4530 Sarah Loop, Pocatello, ID 83202 and is currently estimated at $398,028, approximately $187 per square foot. 4530 Sarah Loop is a home located in Bannock County with nearby schools including Chubbuck Elementary School, Hawthorne Middle School, and Highland High School.
Ownership History
Date
Name
Owned For
Owner Type
Purchase Details
Closed on
Oct 22, 2014
Sold by
Rogers L Norman and Marie Rogers A
Bought by
Knowles Dustin
Current Estimated Value
Home Financials for this Owner
Home Financials are based on the most recent Mortgage that was taken out on this home.
Original Mortgage
$177,300
Interest Rate
4.1%
Mortgage Type
Seller Take Back
Purchase Details
Closed on
Jul 31, 2014
Sold by
Schroeder Brad R and Schroeder Emily C
Bought by
Rogers L Norman and Marie Rogers A
Purchase Details
Closed on
Mar 10, 2008
Sold by
Woodland Hills Homes Llc
Bought by
Schroeder Brad R and Schroeder Emily C
Home Financials for this Owner
Home Financials are based on the most recent Mortgage that was taken out on this home.
Original Mortgage
$180,000
Interest Rate
5.65%
Mortgage Type
New Conventional
Purchase Details
Closed on
Feb 20, 2005
Sold by
Andreason Carol L
Bought by
Andreason Carol L and Carol L Andreason Trust
Create a Home Valuation Report for This Property
The Home Valuation Report is an in-depth analysis detailing your home's value as well as a comparison with similar homes in the area
Home Values in the Area
Average Home Value in this Area
Purchase History
| Date | Buyer | Sale Price | Title Company |
|---|---|---|---|
| Knowles Dustin | -- | First American Title Company | |
| Rogers L Norman | -- | First American Title | |
| Schroeder Brad R | -- | -- | |
| Andreason Carol L | -- | -- |
Source: Public Records
Mortgage History
| Date | Status | Borrower | Loan Amount |
|---|---|---|---|
| Closed | Knowles Dustin | $177,300 | |
| Previous Owner | Schroeder Brad R | $180,000 |
Source: Public Records
Tax History
| Year | Tax Paid | Tax Assessment Tax Assessment Total Assessment is a certain percentage of the fair market value that is determined by local assessors to be the total taxable value of land and additions on the property. | Land | Improvement |
|---|---|---|---|---|
| 2025 | $2,707 | $400,133 | $79,000 | $321,133 |
| 2024 | $2,966 | $356,948 | $79,000 | $277,948 |
| 2023 | $3,083 | $383,735 | $79,000 | $304,735 |
| 2022 | $3,083 | $290,773 | $50,025 | $240,748 |
| 2021 | $2,789 | $290,773 | $50,025 | $240,748 |
| 2020 | $2,469 | $260,502 | $50,025 | $210,477 |
| 2019 | $2,284 | $217,739 | $40,020 | $177,719 |
| 2018 | $1,955 | $177,101 | $29,000 | $148,101 |
| 2017 | $1,910 | $177,101 | $29,000 | $148,101 |
| 2016 | $1,907 | $177,101 | $29,000 | $148,101 |
| 2015 | $1,944 | $0 | $0 | $0 |
| 2012 | -- | $170,675 | $33,250 | $137,425 |
Source: Public Records
Map
Nearby Homes
- 4565 Sarah Loop
- 856 Sawtooth St
- 957 Pinewood St
- 957 Pinewood Ave
- 802 Bonanza Ave
- 4546 Hershey Loop
- 741 Bonanza Ave
- 1018 Alpine Ave
- 4543 Independence Ave
- 4633 Tahoe Place
- 4656 Independence Ave
- 1073 Alpine Ave
- 934 Margaret St
- 964 Margaret St
- 4580 Rasmussen Ct
- 4274 Henderson Ln
- 4292 E Arizona Dr
- 1084 Concord St
- 1795 N Arizona Dr
- 4306 E Arizona Dr
- 4534 Sarah Loop
- 4526 Sarah Loop
- 4529 Ponderosa St
- 4539 Ponderosa St
- 4540 Sarah Loop
- 4522 Sarah Loop
- 4559 Ponderosa St
- 4529 Sarah Loop
- 4509 Ponderosa St
- 890 Pinewood St
- 4518 Sarah Loop
- 4564 Sarah Ave
- 4564 Sarah Loop
- 4569 Ponderosa St
- 4541 Sarah Loop
- 4513 Sarah Loop
- 4514 Sarah Loop
- 897 Pinewood St
- 891 Pinewood St
- 4570 Sarah Loop
Your Personal Tour Guide
Ask me questions while you tour the home.