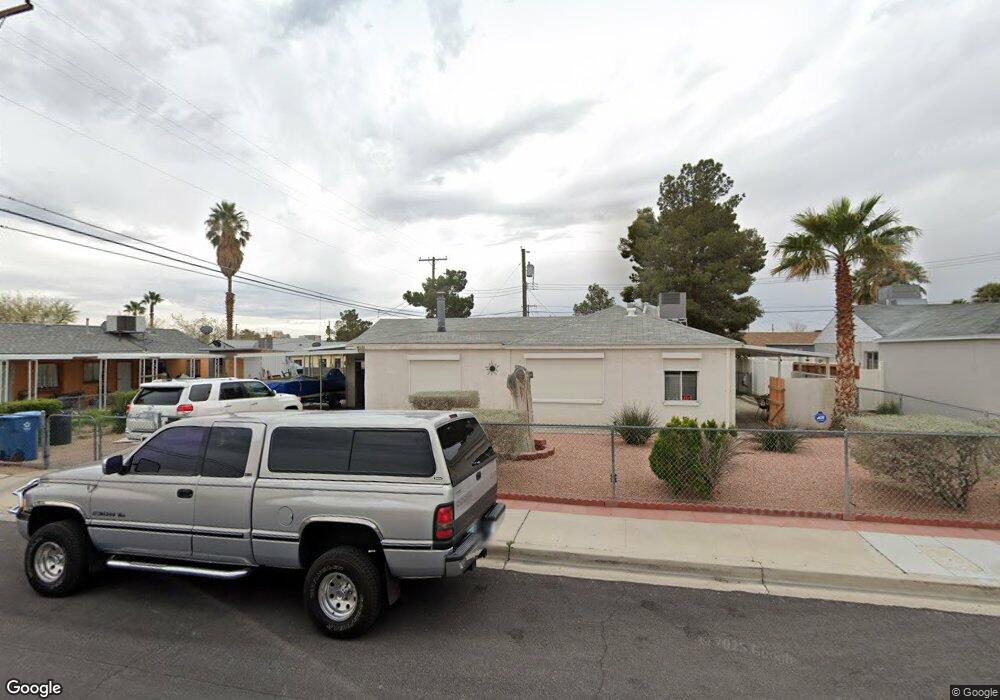
4531 Dover Place Las Vegas, NV 89107
Meadows NeighborhoodEstimated Value: $305,999 - $358,000
3
Beds
1
Bath
1,440
Sq Ft
$225/Sq Ft
Est. Value
About This Home
This home is located at 4531 Dover Place, Las Vegas, NV 89107 and is currently estimated at $324,250, approximately $225 per square foot. 4531 Dover Place is a home located in Clark County with nearby schools including E.W. Griffith Elementary School, Hyde Park Middle School, and Western High School.
Ownership History
Date
Name
Owned For
Owner Type
Purchase Details
Closed on
Mar 26, 2008
Sold by
Throenle Karine J
Bought by
Throenle Karine M
Current Estimated Value
Purchase Details
Closed on
Feb 19, 2008
Sold by
Throenle Karine M and Throenle Donald T
Bought by
Throenle Karine J
Purchase Details
Closed on
Oct 16, 2007
Sold by
Throenle Karine M
Bought by
Throenle Karine M and Throenle Donald T
Purchase Details
Closed on
May 22, 2006
Sold by
Throenle Karine M and Throenle Donald T
Bought by
Throenle Karine M
Purchase Details
Closed on
Jan 16, 2002
Sold by
Mireles Karine M and Keller Karine Martha
Bought by
Throenle Donald T and Throenle Karine M
Purchase Details
Closed on
Apr 16, 1999
Sold by
Chambers David
Bought by
Chambers Karrie and Keller Karrie
Purchase Details
Closed on
Apr 14, 1999
Sold by
Howe Kyle J
Bought by
Howe Kathy and Keller Kathy
Purchase Details
Closed on
Apr 6, 1999
Sold by
Howe Kathy and Chambers Karrie
Bought by
Keller Mireles Karine
Purchase Details
Closed on
Apr 1, 1999
Sold by
Keller Karine Martha
Bought by
Mireles Karine M and Keller Karine Martha
Create a Home Valuation Report for This Property
The Home Valuation Report is an in-depth analysis detailing your home's value as well as a comparison with similar homes in the area
Home Values in the Area
Average Home Value in this Area
Purchase History
| Date | Buyer | Sale Price | Title Company |
|---|---|---|---|
| Throenle Karine M | -- | None Available | |
| Throenle Karine J | -- | None Available | |
| Throenle Karine M | -- | None Available | |
| Throenle Karine M | -- | None Available | |
| Throenle Donald T | -- | -- | |
| Chambers Karrie | -- | United Title | |
| Howe Kathy | -- | United Title | |
| Keller Mireles Karine | -- | United Title | |
| Mireles Karine M | -- | United Title |
Source: Public Records
Tax History Compared to Growth
Tax History
| Year | Tax Paid | Tax Assessment Tax Assessment Total Assessment is a certain percentage of the fair market value that is determined by local assessors to be the total taxable value of land and additions on the property. | Land | Improvement |
|---|---|---|---|---|
| 2025 | $770 | $49,548 | $29,400 | $20,148 |
| 2024 | $748 | $49,548 | $29,400 | $20,148 |
| 2023 | $748 | $48,971 | $30,800 | $18,171 |
| 2022 | $726 | $42,164 | $25,900 | $16,264 |
| 2021 | $705 | $37,207 | $22,050 | $15,157 |
| 2020 | $682 | $36,786 | $22,050 | $14,736 |
| 2019 | $662 | $32,027 | $17,850 | $14,177 |
| 2018 | $643 | $28,022 | $14,700 | $13,322 |
| 2017 | $846 | $25,802 | $12,600 | $13,202 |
| 2016 | $610 | $21,895 | $9,100 | $12,795 |
| 2015 | $607 | $21,162 | $8,750 | $12,412 |
| 2014 | $590 | $17,448 | $5,250 | $12,198 |
Source: Public Records
Map
Nearby Homes
- 4700 Fulton Place
- 4531 Alpine Place
- 4709 Alpine Place
- 4406 Kay Place
- 716 Cragin Park Dr
- 612 Brush St
- 4504 Nolan Ln
- 600 Berry Cir
- 601 Cragin Park Dr
- 4045 Nightingale Ct Unit 1
- 4404 Mayflower Ln
- 4036 Nightingale Ct
- 5117 Harvest Moon Ln
- 4009 Starfire Ln
- 5132 Del Rey Ave
- 4300 Del Monte Ave
- 705 Northstar St
- 5317 Lytton Ave
- 5326 Evergreen Ave
- 457 Purple Finch Dr
- 4601 Dover Place
- 828 Dover Place
- 900 Dover Place
- 4530 Cory Place
- 4600 Cory Place
- 4607 Dover Place
- 904 Dover Place
- 4530 Dover Place
- 4524 Dover Place
- 4600 Dover Place
- 4518 Dover Place
- 4606 Dover Place
- 4613 Dover Place
- 4612 Cory Place
- 901 Dover Place
- 4531 Evergreen Place
- 4531 Cory Place
- 4525 Evergreen Place
- 4601 Evergreen Place
- 4612 Dover Place