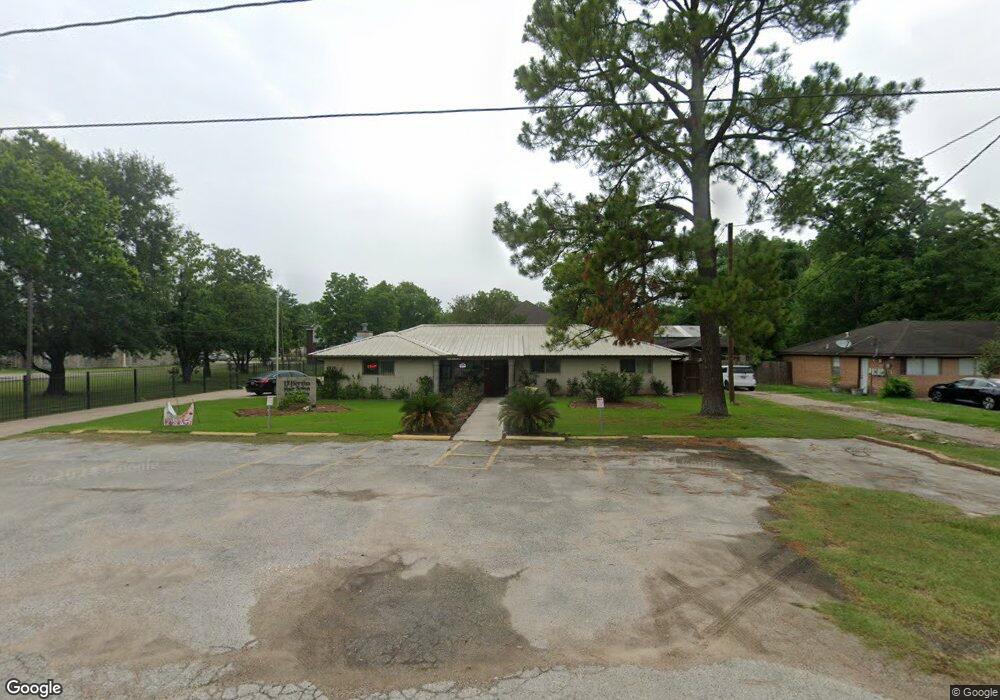
4531 Mount Houston Rd Houston, TX 77093
East Aldine NeighborhoodEstimated Value: $266,000 - $714,000
3
Beds
2
Baths
1,918
Sq Ft
$268/Sq Ft
Est. Value
About This Home
This home is located at 4531 Mount Houston Rd, Houston, TX 77093 and is currently estimated at $513,475, approximately $267 per square foot. 4531 Mount Houston Rd is a home located in Harris County with nearby schools including Vardeman EC/PK/K, Orange Grove Elementary School, and Macarthur Ninth Grade School.
Ownership History
Date
Name
Owned For
Owner Type
Purchase Details
Closed on
Aug 30, 2018
Sold by
Jones Richard Alan and Jones Robert Edward
Bought by
Menries Cherlene P
Current Estimated Value
Purchase Details
Closed on
Mar 18, 2015
Sold by
Gray Elbert F
Bought by
Cavazos David J
Home Financials for this Owner
Home Financials are based on the most recent Mortgage that was taken out on this home.
Original Mortgage
$118,750
Interest Rate
3.6%
Mortgage Type
New Conventional
Purchase Details
Closed on
Jun 5, 2014
Sold by
Tyner James Edward
Bought by
Gray Elbert F
Purchase Details
Closed on
Mar 8, 1996
Sold by
Anthony Sheila Marie
Bought by
Tyner James Edward
Purchase Details
Closed on
Dec 1, 1995
Sold by
Smith Carolyn Anthony and Anthony Woodrow
Bought by
Tyner James Edward
Purchase Details
Closed on
Aug 30, 1994
Sold by
Deborde Ina Ruth
Bought by
Anthony Illa Ruth
Purchase Details
Closed on
Jul 18, 1994
Sold by
Debruhl Helen Ouida and White Theresa Helen
Bought by
Anthony Illa
Create a Home Valuation Report for This Property
The Home Valuation Report is an in-depth analysis detailing your home's value as well as a comparison with similar homes in the area
Home Values in the Area
Average Home Value in this Area
Purchase History
| Date | Buyer | Sale Price | Title Company |
|---|---|---|---|
| Menries Cherlene P | -- | None Available | |
| Cavazos David J | -- | None Available | |
| Gray Elbert F | -- | None Available | |
| Tyner James Edward | -- | -- | |
| Tyner James Edward | -- | -- | |
| Anthony Illa Ruth | -- | Title Agency #40 | |
| Anthony Illa | -- | Title Agency #40 |
Source: Public Records
Mortgage History
| Date | Status | Borrower | Loan Amount |
|---|---|---|---|
| Previous Owner | Cavazos David J | $118,750 |
Source: Public Records
Tax History Compared to Growth
Tax History
| Year | Tax Paid | Tax Assessment Tax Assessment Total Assessment is a certain percentage of the fair market value that is determined by local assessors to be the total taxable value of land and additions on the property. | Land | Improvement |
|---|---|---|---|---|
| 2025 | $8,332 | $784,439 | $271,577 | $512,862 |
| 2024 | $8,332 | $642,924 | $246,888 | $396,036 |
| 2023 | $8,332 | $651,537 | $246,888 | $404,649 |
| 2022 | $10,463 | $559,473 | $99,556 | $459,917 |
| 2021 | $3,337 | $154,812 | $53,602 | $101,210 |
| 2020 | $3,517 | $154,812 | $53,602 | $101,210 |
| 2019 | $3,683 | $154,812 | $53,602 | $101,210 |
| 2018 | $1,922 | $158,848 | $57,638 | $101,210 |
| 2017 | $3,600 | $158,848 | $57,638 | $101,210 |
| 2016 | $3,600 | $158,848 | $57,638 | $101,210 |
| 2015 | $919 | $158,848 | $57,638 | $101,210 |
| 2014 | $919 | $158,848 | $57,638 | $101,210 |
Source: Public Records
Map
Nearby Homes
- 4522 Collins Rd
- 9213 Washington St
- 11769 Gloger St
- 11937 Connor St
- 11781 Eastex Fwy
- 4007 Wedgewood St
- 4415 Mooney Rd
- 4803 Bethany Ln
- 4801 Marquita Ln
- 11375 Allwood St
- 11206 Eastex Fwy
- 5404 Mount Houston Rd
- 3111 Hartwick Rd
- 3214 Brea Crest St
- 3418 Hopper Rd
- 4002 Charriton Dr
- 4422 Sandydale Ln
- 4410 Shelton Rd
- 3804 Cedar Hill Ln
- 2915 Brea Crest St
- 4601 Mount Houston Rd
- 4519 Mount Houston Rd
- 4621 Mount Houston Rd
- 4515 Mount Houston Rd
- 4611 Justin St
- 4629 Mount Houston Rd
- 4618 Mount Houston Rd
- 4626 Mount Houston Rd
- 11721 Vickery St
- 4619 Justin St
- 4538 Orange Grove Dr
- 4630 Mount Houston Rd
- 4609 Collins Rd
- 0 Justin St Unit 66589591
- 0 Justin St Unit 24182526
- 4613 Collins Rd
- 4621 Justin St Unit 1
- 4622 Justin St
- 4406 Mount Houston Rd
- 4602 Orange Grove Dr