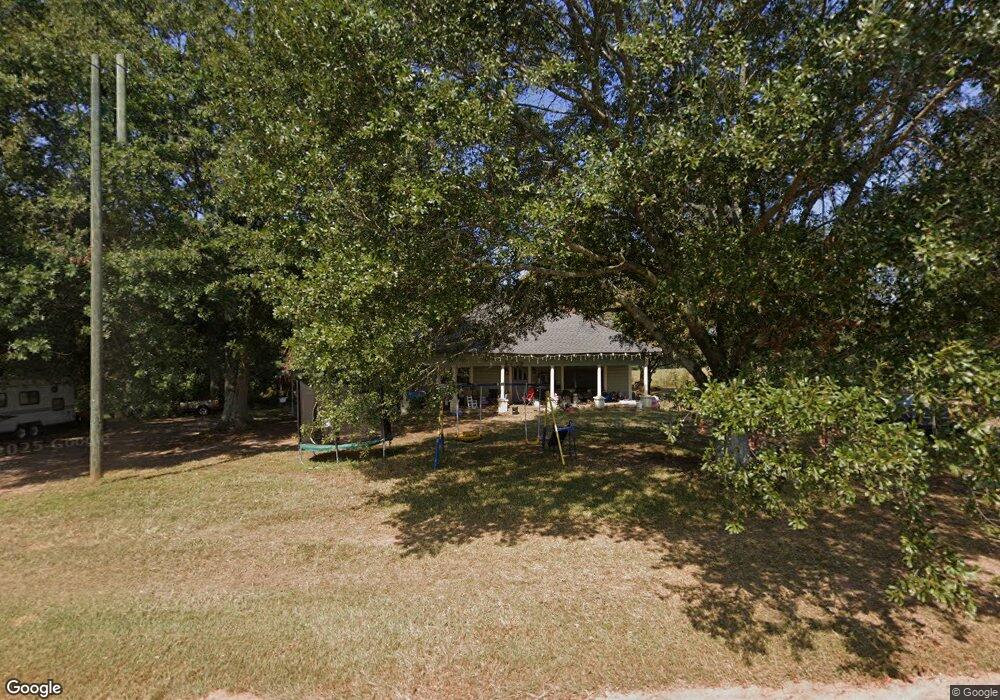
4531 Tyus Carrollton Rd Carrollton, GA 30117
Estimated Value: $160,491 - $343,000
4
Beds
3
Baths
1,984
Sq Ft
$135/Sq Ft
Est. Value
About This Home
This home is located at 4531 Tyus Carrollton Rd, Carrollton, GA 30117 and is currently estimated at $267,873, approximately $135 per square foot. 4531 Tyus Carrollton Rd is a home located in Carroll County with nearby schools including Bowdon Elementary School, Bowdon Middle School, and Bowdon High School.
Ownership History
Date
Name
Owned For
Owner Type
Purchase Details
Closed on
Jul 20, 2021
Sold by
Mattocks Ryan
Bought by
Shurden Pstricis and Chaffin Anndrea
Current Estimated Value
Purchase Details
Closed on
Apr 15, 2021
Sold by
Sprewell Mark M
Bought by
Mattocks Ryan
Purchase Details
Closed on
Feb 19, 2021
Sold by
Mayfield Terry
Bought by
Sprewell Mark M
Purchase Details
Closed on
Feb 6, 2012
Sold by
Mayfield Susan
Bought by
Mayfield Terry Dwayne
Purchase Details
Closed on
May 6, 2010
Sold by
Regions Bank
Bought by
Mayfield Terry
Purchase Details
Closed on
Jul 7, 2009
Sold by
Bowen Wayne
Bought by
Regions Bank
Purchase Details
Closed on
Oct 1, 2002
Sold by
Lovvorn Verbon B and Lovvorn L
Bought by
Bowen Wayne
Purchase Details
Closed on
Apr 17, 1997
Sold by
Jackson W L
Bought by
Lovvorn Verbon B and Lovvorn L
Create a Home Valuation Report for This Property
The Home Valuation Report is an in-depth analysis detailing your home's value as well as a comparison with similar homes in the area
Home Values in the Area
Average Home Value in this Area
Purchase History
| Date | Buyer | Sale Price | Title Company |
|---|---|---|---|
| Shurden Pstricis | $87,500 | -- | |
| Mattocks Ryan | $61,000 | -- | |
| Sprewell Mark M | $50,000 | -- | |
| Mayfield Terry Dwayne | -- | -- | |
| Mayfield Terry | $50,000 | -- | |
| Regions Bank | $63,200 | -- | |
| Bowen Wayne | $76,600 | -- | |
| Lovvorn Verbon B | $47,000 | -- |
Source: Public Records
Tax History Compared to Growth
Tax History
| Year | Tax Paid | Tax Assessment Tax Assessment Total Assessment is a certain percentage of the fair market value that is determined by local assessors to be the total taxable value of land and additions on the property. | Land | Improvement |
|---|---|---|---|---|
| 2024 | $2,176 | $96,180 | $12,097 | $84,083 |
| 2023 | $2,176 | $86,080 | $9,678 | $76,402 |
| 2022 | $878 | $49,646 | $6,452 | $43,194 |
| 2021 | $874 | $42,267 | $5,162 | $37,105 |
| 2020 | $798 | $38,025 | $4,692 | $33,333 |
| 2019 | $757 | $35,447 | $4,692 | $30,755 |
| 2018 | $707 | $32,124 | $4,385 | $27,739 |
| 2017 | $709 | $32,124 | $4,385 | $27,739 |
| 2016 | $709 | $32,124 | $4,385 | $27,739 |
| 2015 | $679 | $28,264 | $5,898 | $22,366 |
| 2014 | $682 | $28,265 | $5,898 | $22,366 |
Source: Public Records
Map
Nearby Homes
- 4228 Tyus Carrollton Rd
- 4144 Tyus Carrollton Rd
- TRACT 2 Attaway Rd Unit TRACT 4.59 ACRES
- Tract 1 Attaway Road Tract 4 15 Acres Unit 185
- TRACT 1 Attaway Rd Unit 4.15 ACRES
- 1698 Georgia 5
- TRACT 2 Attaway Road Tract 4 59 Acres Unit 185
- 1187 Attaway Rd
- 630 Stoney Point Rd
- 3071 Georgia 5
- 3083 Georgia 5
- 3101 Georgia 5
- 1358 W 5 Hwy
- 3129 Georgia 5
- 0 Needmore Rd Unit (345.37 ACRES)
- 0 Needmore Rd Unit (345 37 Acres)
- 0 Needmore Road- (345 37 Acres)
- 75 Dashboard Rd
- 0 Old Columbus Rd Unit 24031335
- 0 Old Columbus Rd Unit 10554750
- 4581 Tyus Carrollton Rd
- 4567 Tyus Carrollton Rd
- 4549 Tyus Carrollton Rd
- 4581 Tyus Carrollton Rd
- 4557 Tyus Carrollton Rd
- 4567 Tyus Carrollton Rd
- 4581 Carrolltontyus Rd
- 2227 W Highway 5 Hwy
- 4557 Carrollton Tyus Rd
- 4564 Tyus Carrollton Rd
- 2227 W Highway 5
- 2227 W Highway 5
- 4514 Tyus Carrollton Rd
- 2291 W Highway 5
- 2291 W Highway 5
- 4481 Tyus Carrollton Rd
- 3356 Bowdon Tyus Rd
- 0 W Hwy 5 New Mexico Rd Unit 20089537
- 3336 Bowdon Tyus Rd
- 2108 W Highway 5