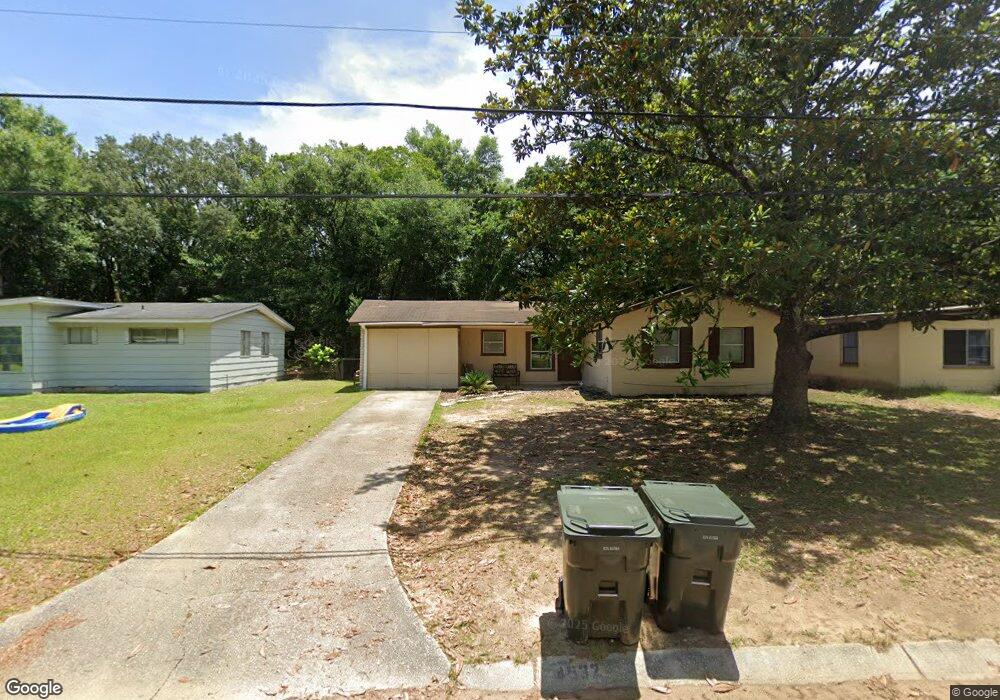
4532 E Montclair Rd Unit 1 Pensacola, FL 32505
Estimated Value: $109,000 - $140,000
--
Bed
1
Bath
855
Sq Ft
$145/Sq Ft
Est. Value
About This Home
This home is located at 4532 E Montclair Rd Unit 1, Pensacola, FL 32505 and is currently estimated at $124,264, approximately $145 per square foot. 4532 E Montclair Rd Unit 1 is a home located in Escambia County with nearby schools including Montclair Elementary School, Bellview Middle School, and Pensacola High School.
Ownership History
Date
Name
Owned For
Owner Type
Purchase Details
Closed on
Jan 21, 2011
Sold by
Rushing Edward L
Bought by
Chiefs Endeavors Llc
Current Estimated Value
Purchase Details
Closed on
Jan 14, 2011
Sold by
Rushing Dwyke L
Bought by
Rushing Edward L
Purchase Details
Closed on
Jan 6, 2011
Sold by
Rasmussen Cynthia D
Bought by
Rushing Edward L
Purchase Details
Closed on
May 1, 2009
Sold by
Rushing Julia O and Revocable Living Trust Agreeme
Bought by
Pensacola Houses Limited Partnership
Purchase Details
Closed on
Jan 28, 2009
Sold by
Rushing Julia O and Revocable Living Trust Agreeme
Bought by
Rushing Partners Limited Partnership
Purchase Details
Closed on
Aug 12, 2005
Sold by
Hud
Bought by
Rushing Lloyd G and Rushing Julia O
Purchase Details
Closed on
Mar 23, 2005
Sold by
Well Fargo Bank Na
Bought by
Hud
Create a Home Valuation Report for This Property
The Home Valuation Report is an in-depth analysis detailing your home's value as well as a comparison with similar homes in the area
Home Values in the Area
Average Home Value in this Area
Purchase History
| Date | Buyer | Sale Price | Title Company |
|---|---|---|---|
| Chiefs Endeavors Llc | -- | Attorney | |
| Rushing Edward L | $1,660,600 | Attorney | |
| Rushing Edward L | $1,403,300 | Attorney | |
| Rushing Edward L | -- | Attorney | |
| Dce Llc | -- | Attorney | |
| Pensacola Houses Llc | -- | Attorney | |
| Pensacola Houses Limited Partnership | -- | Attorney | |
| Rushing Julia O | -- | Attorney | |
| Rushing Partners Limited Partnership | -- | Attorney | |
| Rushing Lloyd G | $28,500 | -- | |
| Hud | -- | -- |
Source: Public Records
Tax History Compared to Growth
Tax History
| Year | Tax Paid | Tax Assessment Tax Assessment Total Assessment is a certain percentage of the fair market value that is determined by local assessors to be the total taxable value of land and additions on the property. | Land | Improvement |
|---|---|---|---|---|
| 2024 | $1,052 | $87,088 | $15,000 | $72,088 |
| 2023 | $1,052 | $64,570 | $0 | $0 |
| 2022 | $951 | $66,086 | $5,000 | $61,086 |
| 2021 | $864 | $53,364 | $0 | $0 |
| 2020 | $793 | $49,048 | $0 | $0 |
| 2019 | $759 | $46,163 | $0 | $0 |
| 2018 | $727 | $42,916 | $0 | $0 |
| 2017 | $786 | $46,130 | $0 | $0 |
| 2016 | $782 | $45,059 | $0 | $0 |
| 2015 | $763 | $44,730 | $0 | $0 |
| 2014 | $729 | $42,899 | $0 | $0 |
Source: Public Records
Map
Nearby Homes
- 701 Montclair Rd
- 718 Montclair Rd
- 800 Montclair Rd
- 809 Fremont Ave
- 812 Montclair Rd
- 810 Lucerne Ave
- 4494 Landes Dr
- 4517 Monpellier Dr
- 907 Montclair Rd
- 616 Massachusetts Ave
- 425 Bayliss Ct
- 316 Rosalyn Way
- 602 Palm Ct
- 914 Lucerne Ave
- 913 Belair Rd
- 303 Yoakum Ct
- 4260 Erress Blvd
- 4505 Ellysee Way
- 109 Bayliss Ct
- 4514 Florelle Way
- 4534 E Montclair Rd
- 4530 E Montclair Rd
- 0 Seine Way
- 4536 E Montclair Rd
- 4528 E Montclair Rd
- 702 Seine Way
- 4526 E Montclair Rd
- 701 Seine Way
- 4880 E Montclair Rd
- 4538 E Montclair Rd
- 704 Seine Way
- 703 Seine Way
- 4524 E Montclair Rd
- 703 Montclair Rd
- 702 Roanne Ln
- 706 Seine Way
- 4540 E Montclair Rd
- 705 Seine Way
- 0 Roanne Ln
- 704 Roanne Ln