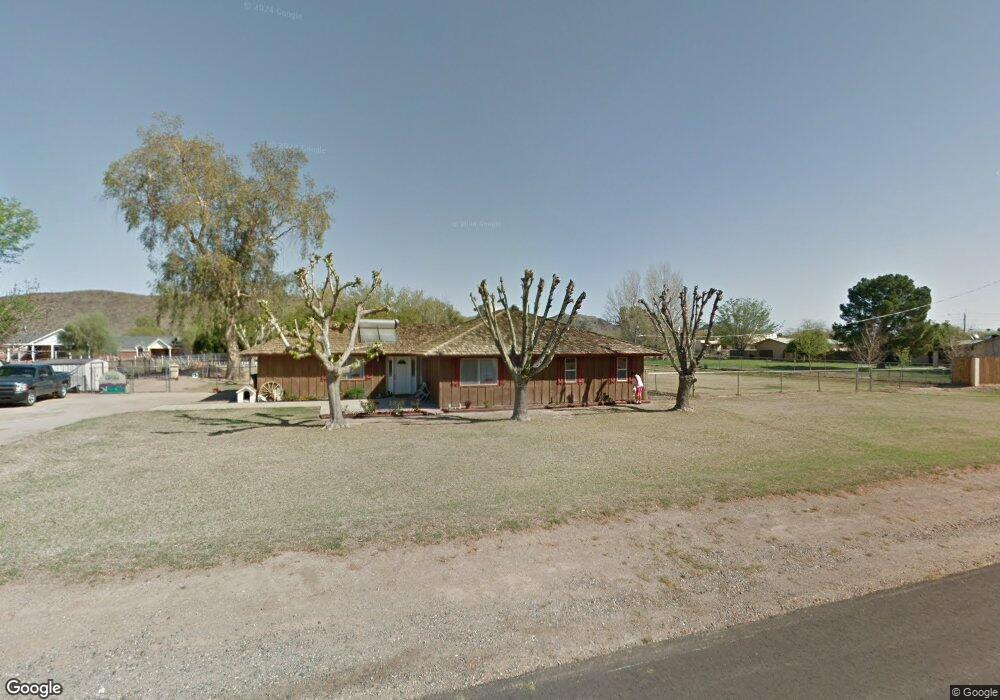
4532 W Crivello Ave Laveen, AZ 85339
Laveen NeighborhoodEstimated Value: $429,145 - $548,000
--
Bed
2
Baths
1,608
Sq Ft
$317/Sq Ft
Est. Value
About This Home
This home is located at 4532 W Crivello Ave, Laveen, AZ 85339 and is currently estimated at $510,536, approximately $317 per square foot. 4532 W Crivello Ave is a home located in Maricopa County with nearby schools including Betty Fairfax High School, Phoenix Coding Academy, and Legacy Traditional School - Laveen Village.
Ownership History
Date
Name
Owned For
Owner Type
Purchase Details
Closed on
Oct 22, 2013
Sold by
Saunders Jacquelyn
Bought by
Saunders Jacquelyn and Townsell Antonio
Current Estimated Value
Purchase Details
Closed on
Dec 21, 2007
Sold by
Kugler Kevin
Bought by
Kugler Kevin and Sanders Jacquelyn M
Home Financials for this Owner
Home Financials are based on the most recent Mortgage that was taken out on this home.
Original Mortgage
$178,000
Outstanding Balance
$110,670
Interest Rate
5.96%
Mortgage Type
New Conventional
Estimated Equity
$399,866
Purchase Details
Closed on
May 10, 1995
Sold by
Samples Karen A
Bought by
Kugler Kevin
Home Financials for this Owner
Home Financials are based on the most recent Mortgage that was taken out on this home.
Original Mortgage
$118,450
Interest Rate
8.32%
Mortgage Type
VA
Create a Home Valuation Report for This Property
The Home Valuation Report is an in-depth analysis detailing your home's value as well as a comparison with similar homes in the area
Home Values in the Area
Average Home Value in this Area
Purchase History
| Date | Buyer | Sale Price | Title Company |
|---|---|---|---|
| Saunders Jacquelyn | -- | None Available | |
| Kugler Kevin | -- | None Available | |
| Kugler Kevin | $115,000 | Transamerica Title Ins Co |
Source: Public Records
Mortgage History
| Date | Status | Borrower | Loan Amount |
|---|---|---|---|
| Open | Kugler Kevin | $178,000 | |
| Closed | Kugler Kevin | $118,450 |
Source: Public Records
Tax History Compared to Growth
Tax History
| Year | Tax Paid | Tax Assessment Tax Assessment Total Assessment is a certain percentage of the fair market value that is determined by local assessors to be the total taxable value of land and additions on the property. | Land | Improvement |
|---|---|---|---|---|
| 2025 | $1,903 | $13,678 | -- | -- |
| 2024 | $1,866 | $13,026 | -- | -- |
| 2023 | $1,866 | $35,770 | $7,150 | $28,620 |
| 2022 | $1,818 | $26,960 | $5,390 | $21,570 |
| 2021 | $1,852 | $25,560 | $5,110 | $20,450 |
| 2020 | $1,797 | $23,620 | $4,720 | $18,900 |
| 2019 | $1,810 | $21,480 | $4,290 | $17,190 |
| 2018 | $1,746 | $17,150 | $3,430 | $13,720 |
| 2017 | $1,653 | $14,650 | $2,930 | $11,720 |
| 2016 | $1,573 | $12,600 | $2,520 | $10,080 |
| 2015 | $1,465 | $12,000 | $2,400 | $9,600 |
Source: Public Records
Map
Nearby Homes
- 4427 W Cll Poco
- 4304 W Cll Poco
- 4019 W Gumina Ave W Unit 15
- 5029 Top Hand Trail
- 5029 W Top Hand Trail
- Agate Plan at Laveen Vistas - Seasons
- Emerald Plan at Laveen Vistas - Seasons
- Harley Plan at Laveen Vistas - Seasons
- Slate Plan at Laveen Vistas - Seasons
- Elderberry Plan at Laveen Vistas - Seasons
- 3939 W Fox Rd
- 5023 W Hardtack Trail
- 11514 S 50th Ln
- 5027 W Hardtack Trail
- 5036 W Roundhouse Rd
- 5014 W Hardtack Trail
- 5018 W Hardtack Trail
- 11420 S 50th Ln
- 5022 W Hardtack Trail
- 0 W Kayenta Trail Unit 6779097
- 4518 W Crivello Ave
- 4546 W Crivello Ave
- 4537 W Gumina Ave
- 4531 W Crivello Ave
- 4519 W Gumina Ave
- 4601 W Gumina Ave
- 4545 W Crivello Ave
- 4517 W Crivello Ave
- 4602 W Crivello Ave
- 4502 W Crivello Ave
- 4501 W Gumina Ave
- 4617 W Gumina Ave
- 4601 W Crivello Ave
- 4501 W Crivello Ave
- 4544 W Gumina Ave
- 4532 W Estrella Dr
- 4520 W Gumina Ave
- 4618 W Crivello Ave Unit 19
- 4546 W Estrella Dr
- 4518 W Estrella Dr