Estimated Value: $371,000 - $441,000
5
Beds
3
Baths
3,024
Sq Ft
$137/Sq Ft
Est. Value
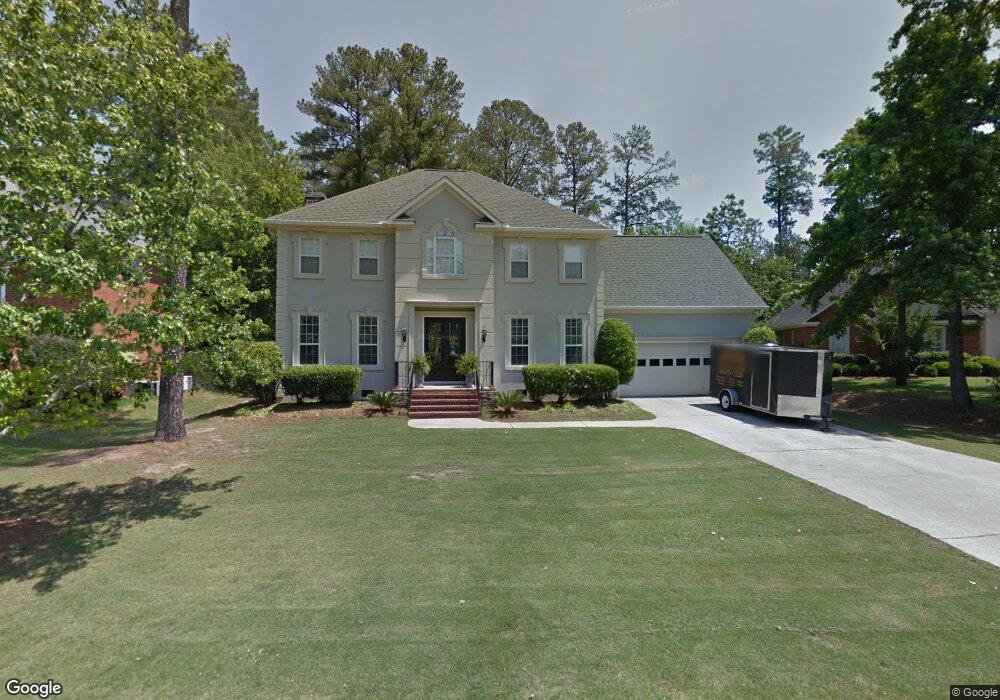
About This Home
This home is located at 4533 Bellingham Ct, Evans, GA 30809 and is currently estimated at $414,499, approximately $137 per square foot. 4533 Bellingham Ct is a home located in Columbia County with nearby schools including Riverside Elementary School, Riverside Middle School, and Greenbrier High School.
Ownership History
Date
Name
Owned For
Owner Type
Purchase Details
Closed on
Mar 10, 2025
Sold by
Jaeger Kimberly Ann
Bought by
Jaeger Isabella Grace and Penland Edward Scott
Current Estimated Value
Purchase Details
Closed on
Nov 12, 2010
Sold by
Jaeger Udo
Bought by
Jaegar Kim
Home Financials for this Owner
Home Financials are based on the most recent Mortgage that was taken out on this home.
Original Mortgage
$189,500
Interest Rate
4.2%
Mortgage Type
New Conventional
Purchase Details
Closed on
Mar 3, 2006
Sold by
Emc Mortgage Corp
Bought by
Udo
Home Financials for this Owner
Home Financials are based on the most recent Mortgage that was taken out on this home.
Original Mortgage
$195,386
Interest Rate
6.19%
Mortgage Type
New Conventional
Purchase Details
Closed on
Mar 28, 2005
Sold by
Heaney Wendy A
Bought by
Lever Scott Anthony
Purchase Details
Closed on
Jun 1, 2001
Sold by
Songster Jack W and Songster Cheryl
Bought by
Lever Scott Anthony and Heaney Wendy A
Home Financials for this Owner
Home Financials are based on the most recent Mortgage that was taken out on this home.
Original Mortgage
$196,550
Interest Rate
7.05%
Create a Home Valuation Report for This Property
The Home Valuation Report is an in-depth analysis detailing your home's value as well as a comparison with similar homes in the area
Home Values in the Area
Average Home Value in this Area
Purchase History
| Date | Buyer | Sale Price | Title Company |
|---|---|---|---|
| Jaeger Isabella Grace | -- | -- | |
| Jaegar Kim | -- | -- | |
| Udo | $240,000 | -- | |
| Lever Scott Anthony | -- | -- | |
| Lever Scott Anthony | $206,900 | -- |
Source: Public Records
Mortgage History
| Date | Status | Borrower | Loan Amount |
|---|---|---|---|
| Previous Owner | Jaegar Kim | $189,500 | |
| Previous Owner | Udo | $195,386 | |
| Previous Owner | Lever Scott Anthony | $196,550 |
Source: Public Records
Tax History
| Year | Tax Paid | Tax Assessment Tax Assessment Total Assessment is a certain percentage of the fair market value that is determined by local assessors to be the total taxable value of land and additions on the property. | Land | Improvement |
|---|---|---|---|---|
| 2025 | $4,162 | $174,055 | $29,904 | $144,151 |
| 2024 | $4,327 | $172,846 | $29,304 | $143,542 |
| 2023 | $4,327 | $162,155 | $28,004 | $134,151 |
| 2022 | $3,824 | $146,912 | $25,904 | $121,008 |
| 2021 | $3,290 | $120,834 | $20,804 | $100,030 |
| 2020 | $3,109 | $111,834 | $19,004 | $92,830 |
| 2019 | $3,015 | $108,438 | $19,804 | $88,634 |
| 2018 | $2,949 | $105,690 | $18,404 | $87,286 |
| 2017 | $2,952 | $105,432 | $17,704 | $87,728 |
| 2016 | $2,432 | $90,040 | $17,580 | $72,460 |
| 2015 | $2,308 | $85,281 | $16,480 | $68,801 |
| 2014 | $2,330 | $85,060 | $17,480 | $67,580 |
Source: Public Records
Map
Nearby Homes
- 4537 Bellingham Ct
- 1357 Montrose Place
- 657 River Oaks Ln
- 667 River Oaks Ln
- 337 Gardenia Dr
- 618 River Oaks Ln
- 616 River Oaks Ln
- 1096 Rivershyre Dr
- 4023 Acorn Ln
- 565 River Oaks Ln
- 1259 Hardy Pointe Dr
- 1108 Rivershyre Dr
- 4599 Hardy McManus Rd
- 2003 Lacebark Ct
- 1077 Waltons Pass
- 1166 Parkside Trail
- 5041 Sussex Dr
- 1031,1041 Hardy Lake Rd
- 1139 Rivershyre Dr
- 4533 Glastonbury Dr
- 4535 Bellingham Ct
- 4531 Bellingham Ct
- 4536 Bellingham Ct
- 4538 Bellingham Ct
- 4529 Bellingham Ct
- 4527 Bellingham Ct
- 4540 Bellingham Ct
- 4539 Bellingham Ct
- 1350 Montrose Place
- 4534 Bellingham Ct
- 4525 Bellingham Ct
- 4689 Hardy McManus Rd
- 1352 Montrose Place
- 1351 Montrose Place
- 4541 Bellingham Ct
- 4532 Bellingham Ct
- 4523 Bellingham Ct
- 4543 Reigate Ct
- 1354 Montrose Place
- 1353 Montrose Place
Your Personal Tour Guide
Ask me questions while you tour the home.