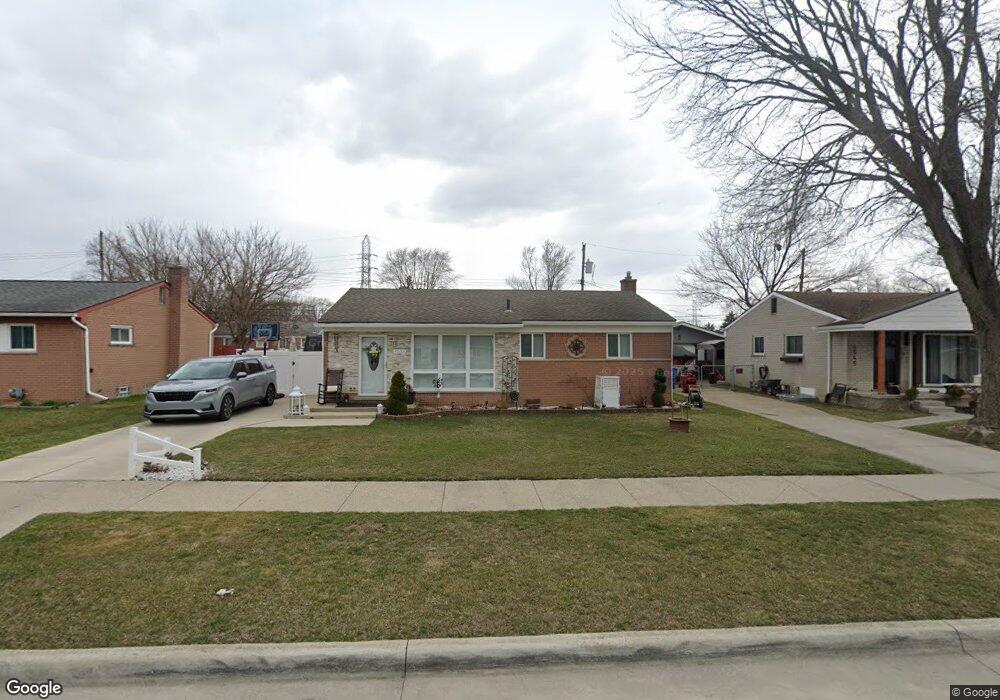
4533 Buchanan Ave Warren, MI 48092
Northwest Warren NeighborhoodEstimated Value: $223,971 - $257,000
3
Beds
2
Baths
1,079
Sq Ft
$226/Sq Ft
Est. Value
About This Home
This home is located at 4533 Buchanan Ave, Warren, MI 48092 and is currently estimated at $243,493, approximately $225 per square foot. 4533 Buchanan Ave is a home located in Macomb County with nearby schools including Green Acres Elementary School, Beer Middle School, and Warren Mott High School.
Ownership History
Date
Name
Owned For
Owner Type
Purchase Details
Closed on
Jan 5, 2018
Sold by
Cook Jason Alan
Bought by
Zaid Ali
Current Estimated Value
Purchase Details
Closed on
Nov 26, 2014
Sold by
Folmer Aloisia and Cook John C
Bought by
Folmer Aloisia
Purchase Details
Closed on
Sep 19, 2013
Sold by
Folmer Aloisa
Bought by
Folmer Aloisa and Cook John C
Purchase Details
Closed on
Sep 29, 2011
Sold by
Gentry Tina
Bought by
Folmer Aloisa
Purchase Details
Closed on
Aug 31, 2010
Sold by
Folmer Aloisa
Bought by
Folmer Aloisa and Gentry Tina Marie
Purchase Details
Closed on
Feb 23, 2010
Sold by
Miller Jerome I and Miller Laura
Bought by
Estate Of Harold George Vokes
Purchase Details
Closed on
Aug 28, 2008
Sold by
Vokes Harold G
Bought by
Vokes Harold G and Miller Jerome I
Purchase Details
Closed on
May 14, 2008
Sold by
Vokes Harold G
Bought by
Vokes Harold G
Create a Home Valuation Report for This Property
The Home Valuation Report is an in-depth analysis detailing your home's value as well as a comparison with similar homes in the area
Home Values in the Area
Average Home Value in this Area
Purchase History
| Date | Buyer | Sale Price | Title Company |
|---|---|---|---|
| Zaid Ali | -- | None Available | |
| Folmer Aloisia | -- | None Available | |
| Folmer Aloisa | -- | None Available | |
| Folmer Aloisa | -- | None Available | |
| Folmer Aloisa | -- | None Available | |
| Estate Of Harold George Vokes | -- | None Available | |
| Vokes Harold G | -- | None Available | |
| Vokes Harold G | -- | None Available |
Source: Public Records
Tax History
| Year | Tax Paid | Tax Assessment Tax Assessment Total Assessment is a certain percentage of the fair market value that is determined by local assessors to be the total taxable value of land and additions on the property. | Land | Improvement |
|---|---|---|---|---|
| 2025 | $3,903 | $106,300 | $0 | $0 |
| 2024 | $38 | $97,650 | $0 | $0 |
| 2023 | $3,620 | $91,860 | $0 | $0 |
| 2022 | $3,498 | $80,310 | $0 | $0 |
| 2021 | $3,559 | $75,930 | $0 | $0 |
| 2020 | $3,432 | $70,010 | $0 | $0 |
| 2019 | $3,308 | $62,210 | $0 | $0 |
| 2018 | $3,625 | $56,050 | $0 | $0 |
| 2017 | $2,506 | $52,330 | $9,210 | $43,120 |
| 2016 | $3,286 | $52,330 | $0 | $0 |
| 2015 | -- | $42,960 | $0 | $0 |
| 2013 | $2,402 | $36,850 | $0 | $0 |
Source: Public Records
Map
Nearby Homes
- 4519 Reader Dr
- 4611 E 13 Mile Rd
- 30987 Boewe Dr
- 4125 Derray Ct Unit 7
- 5239 E 13 Mile Rd
- 4812 Berwyn Dr
- 3651 Chicago Rd
- 30520 Berghway Trail
- 30475 Berghway Trail
- 30055 Boewe Dr
- 4832 Muriel Dr
- 29900 N Grand Oaks Dr
- 32416 Exeter Dr
- 32291 Ryan Rd
- 30802 Dell Ln
- 3090 Brysons Cove Dr
- 5441 Arden Ave
- 5211 Streefkerk Dr
- 4580 Hampton Ct N
- 32930 Chalfonte Dr
- 4545 Buchanan Ave
- 4521 Buchanan Ave
- 4534 Holmes Dr
- 4546 Holmes Dr
- 4522 Holmes Dr
- 4509 Buchanan Ave
- 31311 Blair Dr
- 31323 Blair Dr
- 4510 Holmes Dr
- 4532 Buchanan Ave
- 4544 Buchanan Ave
- 4520 Buchanan Ave
- 4473 Buchanan Ave
- 31335 Blair Dr
- 31245 Blair Dr
- 4474 Holmes Dr
- 4508 Buchanan Ave
- 4461 Buchanan Ave
- 31233 Blair Dr
- 4472 Buchanan Ave
Your Personal Tour Guide
Ask me questions while you tour the home.