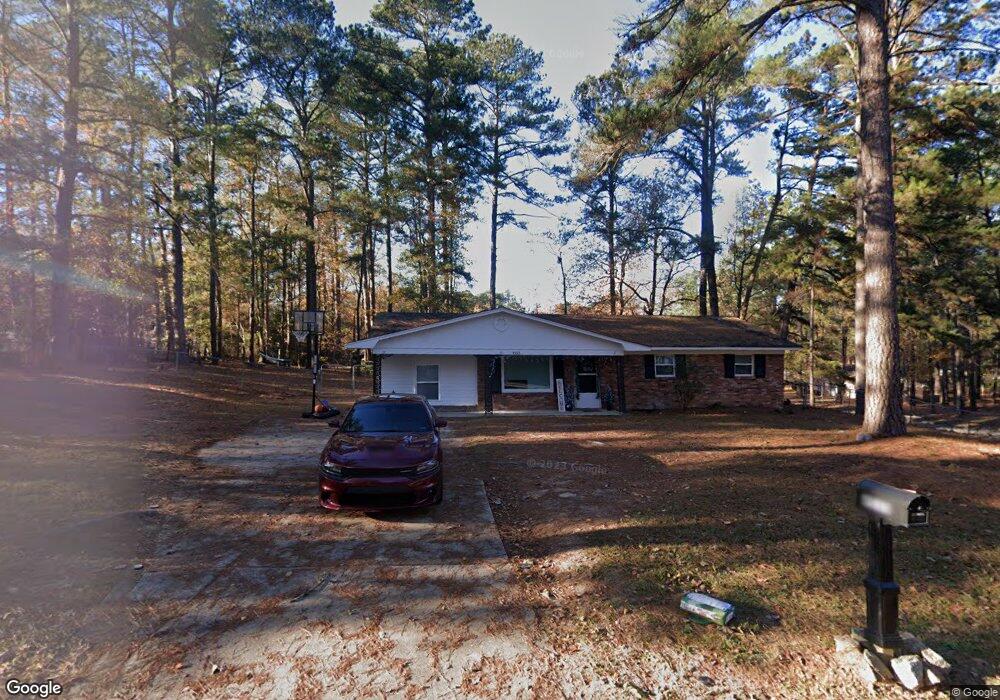
4533 Colonial Rd Augusta, GA 30907
Estimated Value: $222,000 - $225,000
3
Beds
2
Baths
1,115
Sq Ft
$200/Sq Ft
Est. Value
About This Home
This home is located at 4533 Colonial Rd, Augusta, GA 30907 and is currently estimated at $223,538, approximately $200 per square foot. 4533 Colonial Rd is a home located in Columbia County with nearby schools including Westmont Elementary School, Columbia Middle School, and Evans High School.
Ownership History
Date
Name
Owned For
Owner Type
Purchase Details
Closed on
Sep 19, 2022
Sold by
Super Flippin Llc
Bought by
Argerich 2022 1 Llc
Current Estimated Value
Purchase Details
Closed on
Oct 25, 2021
Sold by
Gilmer Kristin
Bought by
Super Flippin Llc
Purchase Details
Closed on
Oct 30, 2009
Sold by
Dinkins Edward F
Bought by
Gilmer Vincent
Home Financials for this Owner
Home Financials are based on the most recent Mortgage that was taken out on this home.
Original Mortgage
$115,000
Interest Rate
4.93%
Mortgage Type
New Conventional
Purchase Details
Closed on
Jul 28, 2005
Sold by
Wheeler Jill R
Bought by
Dinkins Edward F
Purchase Details
Closed on
Aug 1, 2002
Sold by
Vaneck Thomas M and Vaneck Unsil
Bought by
Wheeler Jill R
Home Financials for this Owner
Home Financials are based on the most recent Mortgage that was taken out on this home.
Original Mortgage
$80,634
Interest Rate
6.53%
Mortgage Type
FHA
Create a Home Valuation Report for This Property
The Home Valuation Report is an in-depth analysis detailing your home's value as well as a comparison with similar homes in the area
Home Values in the Area
Average Home Value in this Area
Purchase History
| Date | Buyer | Sale Price | Title Company |
|---|---|---|---|
| Argerich 2022 1 Llc | $209,000 | -- | |
| Super Flippin Llc | $100,000 | -- | |
| Gilmer Vincent | $115,000 | -- | |
| Dinkins Edward F | $88,000 | -- | |
| Wheeler Jill R | $81,900 | -- |
Source: Public Records
Mortgage History
| Date | Status | Borrower | Loan Amount |
|---|---|---|---|
| Previous Owner | Gilmer Vincent | $115,000 | |
| Previous Owner | Wheeler Jill R | $80,634 |
Source: Public Records
Tax History
| Year | Tax Paid | Tax Assessment Tax Assessment Total Assessment is a certain percentage of the fair market value that is determined by local assessors to be the total taxable value of land and additions on the property. | Land | Improvement |
|---|---|---|---|---|
| 2025 | $2,061 | $83,936 | $15,104 | $68,832 |
| 2024 | $2,033 | $79,028 | $16,804 | $62,224 |
| 2023 | $2,033 | $70,223 | $15,104 | $55,119 |
| 2022 | $1,099 | $40,000 | $8,760 | $31,240 |
| 2021 | $1,326 | $48,550 | $11,204 | $37,346 |
| 2020 | $1,219 | $43,698 | $10,204 | $33,494 |
| 2019 | $1,177 | $42,184 | $9,104 | $33,080 |
| 2018 | $1,168 | $41,695 | $9,404 | $32,291 |
| 2017 | $1,107 | $39,409 | $9,604 | $29,805 |
| 2016 | $960 | $35,401 | $8,380 | $27,021 |
| 2015 | $913 | $33,606 | $7,880 | $25,726 |
| 2014 | $951 | $34,598 | $8,280 | $26,318 |
Source: Public Records
Map
Nearby Homes
- 4518 Colonial Rd
- 606 Todd Rd
- 4507 Colonial Rd
- 524 Casey Ct
- 706 Muscadine Ct
- 1447 Collins Dr
- 302 Laurel Place
- 213 S Belair Rd
- 4524 Oakley Pirkle Rd
- 319 Rockdale Rd
- 303 Meadowlake Dr
- 167 S Old Belair Rd
- 618 Matheny Cut
- 289 Ashbrook Dr
- 654 Clinton Way W
- 133 Highview Dr
- 443 S Old Belair Rd
- 4660 Millhaven Rd
- 4367 Quail Creek Rd
- 211 Kestwick Dr W
- 4533 Colonial Rd
- 329 Westmont Dr
- 4537 Colonial Rd
- 335 Westmont Dr
- 4529 Colonial Rd
- 327 Westmont Dr
- 4532 Colonial Rd
- 4539 Colonial Rd
- 328 Westmont Dr
- 334 Westmont Dr
- 4534 Colonial Rd
- 4538 Colonial Rd
- 332 Colonial Ct
- 337 Westmont Dr
- 4536 Colonial Rd
- 4527 Colonial Rd
- 334 Colonial Ct
- 4541 Colonial Rd
- 325 Westmont Dr
- 4524 Colonial Rd
Your Personal Tour Guide
Ask me questions while you tour the home.