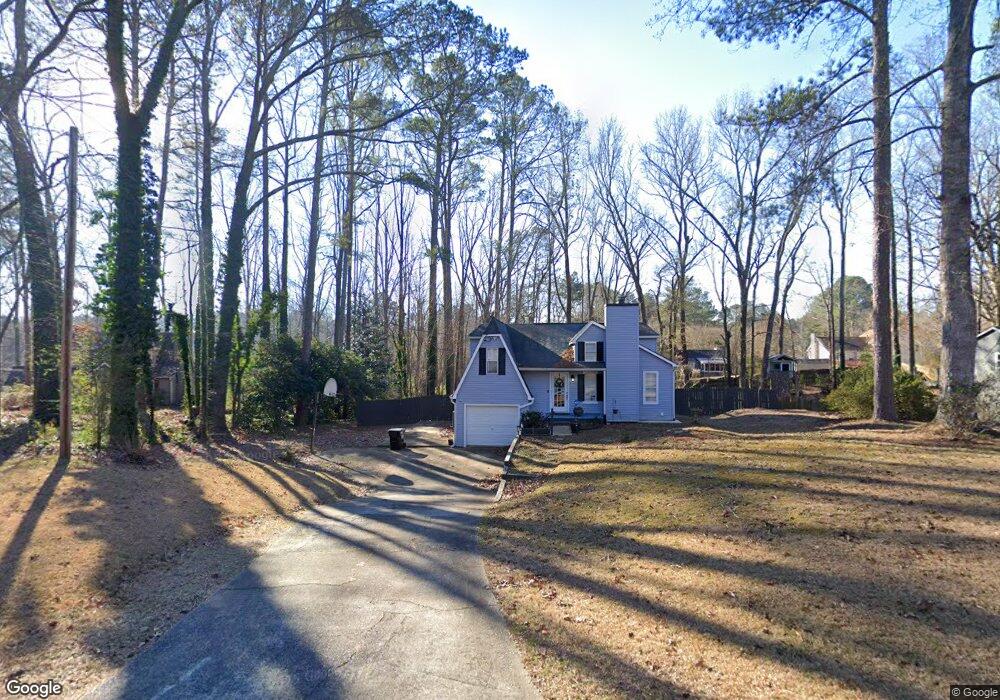
4533 Mars Ct NW Acworth, GA 30101
Estimated Value: $313,000 - $331,000
3
Beds
2
Baths
1,544
Sq Ft
$206/Sq Ft
Est. Value
About This Home
This home is located at 4533 Mars Ct NW, Acworth, GA 30101 and is currently estimated at $318,508, approximately $206 per square foot. 4533 Mars Ct NW is a home located in Cobb County with nearby schools including Frey Elementary School, Mcclure Middle School, and Allatoona High School.
Ownership History
Date
Name
Owned For
Owner Type
Purchase Details
Closed on
May 29, 2009
Sold by
Wymer Nick
Bought by
Reyes Myrna C
Current Estimated Value
Home Financials for this Owner
Home Financials are based on the most recent Mortgage that was taken out on this home.
Original Mortgage
$106,043
Outstanding Balance
$66,820
Interest Rate
4.8%
Mortgage Type
FHA
Estimated Equity
$251,688
Purchase Details
Closed on
Dec 7, 2005
Sold by
Clark Lynette F and Clark Robert L
Bought by
Wymer Nick
Home Financials for this Owner
Home Financials are based on the most recent Mortgage that was taken out on this home.
Original Mortgage
$28,000
Interest Rate
6.29%
Mortgage Type
Stand Alone Refi Refinance Of Original Loan
Purchase Details
Closed on
May 29, 1998
Sold by
Strickland Stuart L and Strickland Tracie G
Bought by
Robinson Lynette F
Home Financials for this Owner
Home Financials are based on the most recent Mortgage that was taken out on this home.
Original Mortgage
$87,200
Interest Rate
7.02%
Mortgage Type
New Conventional
Purchase Details
Closed on
Nov 15, 1993
Sold by
Murray Barry W Anne E
Bought by
Strickland Stuart L
Home Financials for this Owner
Home Financials are based on the most recent Mortgage that was taken out on this home.
Original Mortgage
$73,542
Interest Rate
6.95%
Mortgage Type
FHA
Create a Home Valuation Report for This Property
The Home Valuation Report is an in-depth analysis detailing your home's value as well as a comparison with similar homes in the area
Home Values in the Area
Average Home Value in this Area
Purchase History
| Date | Buyer | Sale Price | Title Company |
|---|---|---|---|
| Reyes Myrna C | $108,000 | -- | |
| Wymer Nick | $140,000 | -- | |
| Robinson Lynette F | $96,900 | -- | |
| Strickland Stuart L | $73,300 | -- |
Source: Public Records
Mortgage History
| Date | Status | Borrower | Loan Amount |
|---|---|---|---|
| Open | Reyes Myrna C | $106,043 | |
| Previous Owner | Wymer Nick | $28,000 | |
| Previous Owner | Robinson Lynette F | $87,200 | |
| Previous Owner | Strickland Stuart L | $73,542 |
Source: Public Records
Tax History Compared to Growth
Tax History
| Year | Tax Paid | Tax Assessment Tax Assessment Total Assessment is a certain percentage of the fair market value that is determined by local assessors to be the total taxable value of land and additions on the property. | Land | Improvement |
|---|---|---|---|---|
| 2025 | $2,599 | $110,412 | $14,000 | $96,412 |
| 2024 | $2,601 | $110,412 | $14,000 | $96,412 |
| 2023 | $2,059 | $110,412 | $14,000 | $96,412 |
| 2022 | $1,649 | $66,000 | $14,000 | $52,000 |
| 2021 | $1,649 | $66,000 | $14,000 | $52,000 |
| 2020 | $1,771 | $71,552 | $14,000 | $57,552 |
| 2019 | $1,511 | $59,700 | $14,000 | $45,700 |
| 2018 | $1,511 | $59,700 | $14,000 | $45,700 |
| 2017 | $1,202 | $50,720 | $14,000 | $36,720 |
| 2016 | $1,148 | $48,808 | $10,800 | $38,008 |
| 2015 | $1,178 | $48,808 | $10,800 | $38,008 |
| 2014 | $722 | $33,132 | $0 | $0 |
Source: Public Records
Map
Nearby Homes
- 4593 Mars Ct NW
- 3070 Mars Hill Church Rd NW
- 4496 Whitt Station Run NW
- 3186 Sail Winds Dr NW
- 2846 Glengyle Park NW
- 2986 Acworth Due West Rd NW
- 3112 Calumet Cir NW
- 4409 Talisker Ln NW
- 4955 Ansbury Place NW Unit 7/D
- 4958 Aviary Dr NW
- 4966 Aviary Dr NW
- 00 Mars Hill Rd
- 4294 Grand Oaks Dr NW Unit 2
- 4245 Mahall Ct NW Unit 1
- 4990 Hill Rd NW
- 3950 Cyrus Crest Cir NW
- 4541 Mars Ct NW
- 4525 Mars Ct NW Unit 2
- 4118 Mars Ct Unit 27
- 1810 Mary Glen Dr
- 4617 Stewart Reilly Dr NW
- 4553 Mars Ct NW
- 4619 Stewart Reilly Dr NW
- 4509 Mars Ct NW
- 4615 Stewart Reilly Dr NW
- 4532 Mars Ct NW
- 4621 Stewart Reilly Dr NW
- 4544 Mars Ct NW Unit 2
- 4561 Mars Ct NW
- 4613 Stewart Reilly Dr NW
- 4520 Mars Ct NW Unit 2
- 4500 Mars Ct NW
- 4623 Stewart Reilly Dr NW
- 4556 Mars Ct NW
- 3101 Blowing Wind Ct NW
- 3105 Blowing Wind Ct NW