Estimated Value: $880,458 - $1,055,000
4
Beds
4
Baths
4,132
Sq Ft
$240/Sq Ft
Est. Value
About This Home
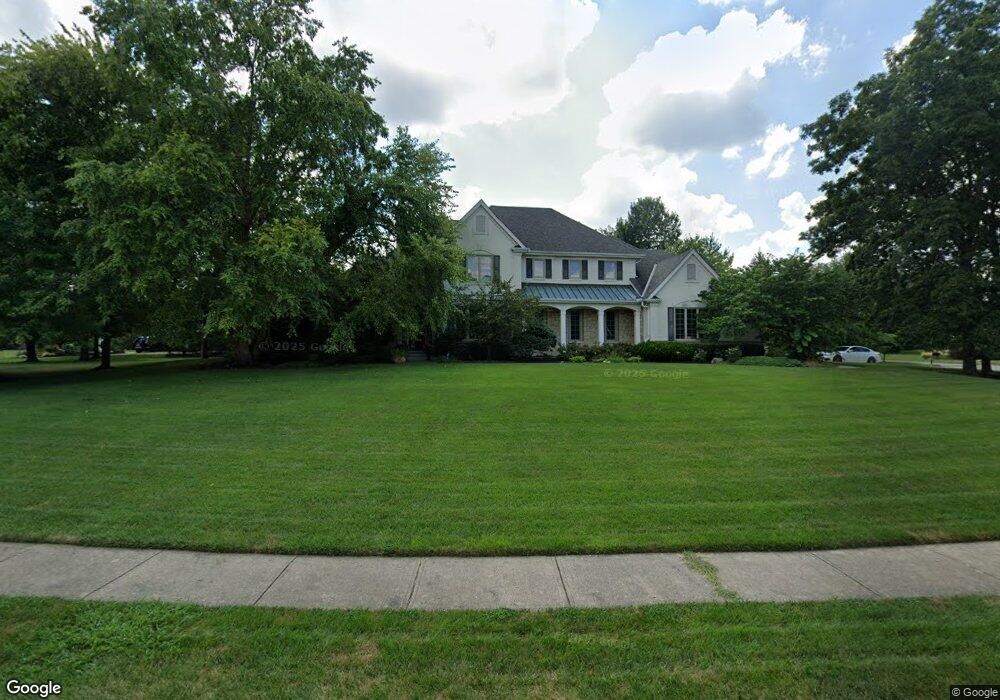
This home is located at 4533 Morris Ct, Mason, OH 45040 and is currently estimated at $993,115, approximately $240 per square foot. 4533 Morris Ct is a home located in Warren County with nearby schools including Mason Intermediate Elementary School, Mason Middle School, and William Mason High School.
Ownership History
Date
Name
Owned For
Owner Type
Purchase Details
Closed on
Jun 30, 2006
Sold by
Williams Terese A and The Terese A Williams Trust
Bought by
Grossmann Thomas E
Current Estimated Value
Home Financials for this Owner
Home Financials are based on the most recent Mortgage that was taken out on this home.
Original Mortgage
$460,000
Outstanding Balance
$265,359
Interest Rate
6.62%
Mortgage Type
Purchase Money Mortgage
Estimated Equity
$727,756
Purchase Details
Closed on
Mar 1, 1996
Sold by
Ford Homes Inc
Bought by
Williams Thomas A and Williams Terese A
Home Financials for this Owner
Home Financials are based on the most recent Mortgage that was taken out on this home.
Original Mortgage
$200,000
Interest Rate
7.07%
Mortgage Type
New Conventional
Purchase Details
Closed on
Jan 9, 1996
Sold by
Heritage Club Ltd
Bought by
Ford Homes Inc
Home Financials for this Owner
Home Financials are based on the most recent Mortgage that was taken out on this home.
Original Mortgage
$200,000
Interest Rate
7.07%
Mortgage Type
New Conventional
Create a Home Valuation Report for This Property
The Home Valuation Report is an in-depth analysis detailing your home's value as well as a comparison with similar homes in the area
Home Values in the Area
Average Home Value in this Area
Purchase History
| Date | Buyer | Sale Price | Title Company |
|---|---|---|---|
| Grossmann Thomas E | $446,666 | None Available | |
| Williams Thomas A | $113,000 | -- | |
| Ford Homes Inc | $97,000 | -- |
Source: Public Records
Mortgage History
| Date | Status | Borrower | Loan Amount |
|---|---|---|---|
| Open | Grossmann Thomas E | $460,000 | |
| Previous Owner | Williams Thomas A | $200,000 |
Source: Public Records
Tax History
| Year | Tax Paid | Tax Assessment Tax Assessment Total Assessment is a certain percentage of the fair market value that is determined by local assessors to be the total taxable value of land and additions on the property. | Land | Improvement |
|---|---|---|---|---|
| 2025 | $10,453 | $257,460 | $57,750 | $199,710 |
| 2024 | $10,453 | $257,460 | $57,750 | $199,710 |
| 2023 | $10,625 | $221,053 | $53,532 | $167,520 |
| 2022 | $10,487 | $221,053 | $53,533 | $167,521 |
| 2021 | $9,708 | $216,118 | $53,533 | $162,586 |
| 2020 | $10,993 | $209,829 | $51,975 | $157,854 |
| 2019 | $8,745 | $181,566 | $51,975 | $129,591 |
| 2018 | $8,775 | $181,566 | $51,975 | $129,591 |
| 2017 | $9,140 | $176,568 | $51,272 | $125,297 |
| 2016 | $9,415 | $176,568 | $51,272 | $125,297 |
| 2015 | $9,435 | $176,568 | $51,272 | $125,297 |
| 2014 | $9,636 | $168,160 | $48,830 | $119,330 |
| 2013 | $9,657 | $198,880 | $57,750 | $141,130 |
Source: Public Records
Map
Nearby Homes
- 4187 Westridge Dr
- 4046 Westridge Dr
- 8333 Verbena Ln
- 8319 Verbena Ln
- 8087 Laurel Lake Ct
- 4089 Ivygrove Ln
- 6495 Lantana Dr
- 4253 Maxwell Dr
- 5415 Roseland
- 4029 Ivygrove Ln
- 6756 Cherry Leaf Ct
- 6461 Foxtail Ln
- 6738 Cherry Leaf Ct
- 6431 Foxtail Ln
- 8340 Poppy Ln
- 8091 Green Lake Dr
- 6306 Caddies Way
- 3794 Wild Cherry Way
- 5747 Richmond Park Dr
- 3521 Helendale Ct
- 4579 Morris Ct
- 4599 Morris Ct
- 4538 Morris Ct
- 4526 Morris Ct
- 4550 Morris Ct
- 4493 Morris Ct
- 4512 Morris Ct
- 4496 Morris Ct
- 4564 Morris Ct
- 4617 Morris Ct
- 4576 Morris Ct
- 4516 Morris Ct
- 4592 Morris Ct
- 4608 Morris Ct
- 4633 Morris Ct
- 4605 Macdonald Ct
- 4630 Morris Ct
- 4615 Macdonald Ct
- 4651 Morris Ct
- 4662 Morris Ct
Your Personal Tour Guide
Ask me questions while you tour the home.