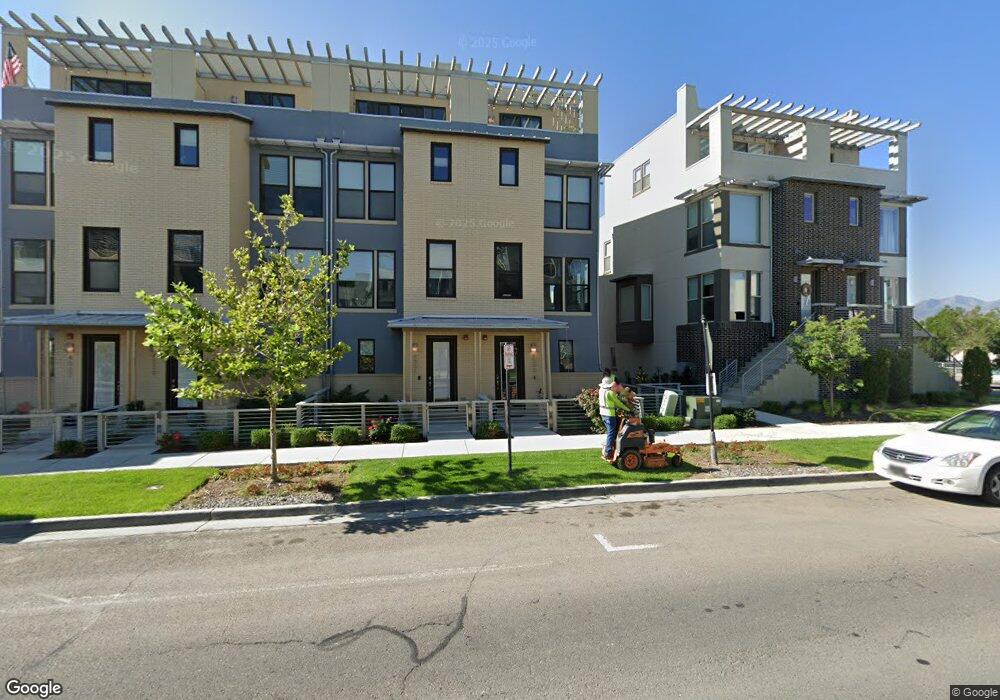
4533 W Daybreak Rim Way South Jordan, UT 84009
Daybreak NeighborhoodEstimated Value: $487,163 - $554,000
3
Beds
3
Baths
2,017
Sq Ft
$261/Sq Ft
Est. Value
About This Home
This home is located at 4533 W Daybreak Rim Way, South Jordan, UT 84009 and is currently estimated at $526,291, approximately $260 per square foot. 4533 W Daybreak Rim Way is a home located in Salt Lake County with nearby schools including Daybreak Elementary School, Mountain Creek Middle School, and Herriman High School.
Ownership History
Date
Name
Owned For
Owner Type
Purchase Details
Closed on
Mar 31, 2021
Sold by
Jennings Traci
Bought by
Jennings Traci and Traci Jennings Trust
Current Estimated Value
Purchase Details
Closed on
Dec 5, 2018
Sold by
Wilson Mark James
Bought by
Jennings Traci
Home Financials for this Owner
Home Financials are based on the most recent Mortgage that was taken out on this home.
Original Mortgage
$260,000
Outstanding Balance
$229,066
Interest Rate
4.8%
Mortgage Type
New Conventional
Estimated Equity
$297,225
Purchase Details
Closed on
Nov 1, 2016
Sold by
Sego Daybreak 6 Lc
Bought by
Wilson Mark James
Home Financials for this Owner
Home Financials are based on the most recent Mortgage that was taken out on this home.
Original Mortgage
$247,419
Interest Rate
3.42%
Mortgage Type
New Conventional
Purchase Details
Closed on
Mar 4, 2016
Sold by
Kennecott Land Co
Bought by
Sego Daybreak 6 Lc
Create a Home Valuation Report for This Property
The Home Valuation Report is an in-depth analysis detailing your home's value as well as a comparison with similar homes in the area
Home Values in the Area
Average Home Value in this Area
Purchase History
| Date | Buyer | Sale Price | Title Company |
|---|---|---|---|
| Jennings Traci | -- | None Available | |
| Jennings Traci | -- | Old Republic Title Draper | |
| Wilson Mark James | -- | Keystone Title Ins Am Fork | |
| Sego Daybreak 6 Lc | -- | First American Title |
Source: Public Records
Mortgage History
| Date | Status | Borrower | Loan Amount |
|---|---|---|---|
| Open | Jennings Traci | $260,000 | |
| Previous Owner | Wilson Mark James | $247,419 |
Source: Public Records
Tax History Compared to Growth
Tax History
| Year | Tax Paid | Tax Assessment Tax Assessment Total Assessment is a certain percentage of the fair market value that is determined by local assessors to be the total taxable value of land and additions on the property. | Land | Improvement |
|---|---|---|---|---|
| 2025 | $2,513 | $487,000 | $47,200 | $439,800 |
| 2024 | $2,513 | $477,100 | $43,400 | $433,700 |
| 2023 | $2,613 | $468,200 | $42,100 | $426,100 |
| 2022 | $2,715 | $476,700 | $41,300 | $435,400 |
| 2021 | $2,228 | $358,900 | $35,400 | $323,500 |
| 2020 | $2,102 | $317,500 | $33,300 | $284,200 |
| 2019 | $2,128 | $315,800 | $33,300 | $282,500 |
| 2018 | $1,983 | $292,900 | $34,800 | $258,100 |
| 2017 | $1,822 | $263,700 | $34,800 | $228,900 |
| 2016 | $461 | $34,800 | $34,800 | $0 |
| 2015 | $474 | $34,800 | $34,800 | $0 |
Source: Public Records
Map
Nearby Homes
- 4563 W Daybreak Rim Way
- 4584 W Daybreak Rim Way
- 4592 W Scissor Way
- 11211 S Clear Blue Dr
- 11347 S Kestrel Rise Rd
- 11076 S Paddle Board Way
- 11064 S Paddle Board Way
- 11213 S Kestrel Rise Rd
- 4555 W Open Hill Dr
- 11048 S Paddle Board Way Unit 3-332
- 4536 W Silent Rain Dr
- 11171 S Kestrel Rise Rd
- Ashland Plan at Cascade Village - Augustine
- Avenel Plan at Cascade Village - Augustine
- Camden Plan at Cascade Village - Augustine
- Sonoma Plan at Cascade Village - Augustine
- 11043 S Lake Island Dr Unit 3-377
- 11037 S Lake Island Dr Unit 3-378
- 11381 Skylux Ave
- 11078 Topview Rd
- 4537 W Daybreak Rim Way
- 4529 W Daybreak Rim Way
- 4527 W Daybreak Rim Way
- 4527 W Daybreak Rim Way Unit 300
- 4541 W Daybreak Rim Way
- 4521 W Daybreak Rim Way
- 11269 S High Crest Ln
- 11267 S High Crest Ln
- 11267 S High Crest Ln Unit 329
- 11271 S High Crest Ln
- 11271 S High Crest Ln
- 11271 S High Crest Ln Unit 327
- 11273 S High Crest Ln Unit 326
- 11275 S High Crest Ln
- 4517 W Daybreak Rim Way Unit 302
- 11289 S High Crest Ln
- 11277 S High Crest Ln
- 11277 S High Crest Ln Unit 324
- 4536 W Daybreak Rim Way
- 11241 S Faddington Way