Estimated Value: $454,490 - $504,000
5
Beds
4
Baths
3,000
Sq Ft
$163/Sq Ft
Est. Value
About This Home
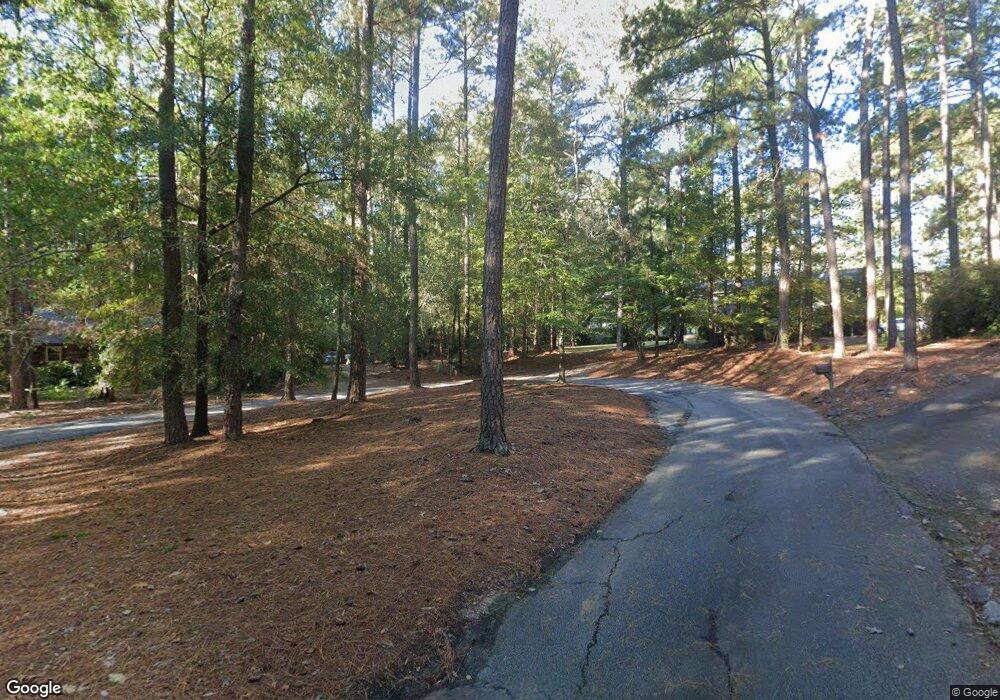
This home is located at 4534 Ridge Pine Ct, Evans, GA 30809 and is currently estimated at $488,623, approximately $162 per square foot. 4534 Ridge Pine Ct is a home located in Columbia County with nearby schools including Northmore Elementary School, Tohopekaliga High School, and River Ridge Elementary School.
Ownership History
Date
Name
Owned For
Owner Type
Purchase Details
Closed on
Mar 12, 2009
Sold by
Primacy Closing Corp
Bought by
White Thomas M
Current Estimated Value
Home Financials for this Owner
Home Financials are based on the most recent Mortgage that was taken out on this home.
Original Mortgage
$230,400
Outstanding Balance
$145,874
Interest Rate
5.13%
Mortgage Type
New Conventional
Estimated Equity
$342,749
Purchase Details
Closed on
Aug 31, 2004
Sold by
Desanti Mark R and Desanti Jan M
Bought by
Shoemaker Michael J
Home Financials for this Owner
Home Financials are based on the most recent Mortgage that was taken out on this home.
Original Mortgage
$150,000
Interest Rate
5.91%
Mortgage Type
Purchase Money Mortgage
Purchase Details
Closed on
Dec 13, 2001
Sold by
Segen Rory D
Bought by
Desanti Mark R and Desanti Jan M
Home Financials for this Owner
Home Financials are based on the most recent Mortgage that was taken out on this home.
Original Mortgage
$140,000
Interest Rate
6.42%
Create a Home Valuation Report for This Property
The Home Valuation Report is an in-depth analysis detailing your home's value as well as a comparison with similar homes in the area
Home Values in the Area
Average Home Value in this Area
Purchase History
| Date | Buyer | Sale Price | Title Company |
|---|---|---|---|
| White Thomas M | $288,000 | -- | |
| Primacy Closing Corp | $288,000 | -- | |
| Shoemaker Michael J | $285,000 | -- | |
| Desanti Mark R | $241,000 | -- |
Source: Public Records
Mortgage History
| Date | Status | Borrower | Loan Amount |
|---|---|---|---|
| Open | Primacy Closing Corp | $230,400 | |
| Closed | Primacy Closing Corp | $230,400 | |
| Previous Owner | Shoemaker Michael J | $150,000 | |
| Previous Owner | Desanti Mark R | $140,000 |
Source: Public Records
Tax History Compared to Growth
Tax History
| Year | Tax Paid | Tax Assessment Tax Assessment Total Assessment is a certain percentage of the fair market value that is determined by local assessors to be the total taxable value of land and additions on the property. | Land | Improvement |
|---|---|---|---|---|
| 2025 | $3,960 | $163,632 | $29,209 | $134,423 |
| 2024 | $4,332 | $171,072 | $33,769 | $137,303 |
| 2023 | $4,332 | $155,173 | $29,494 | $125,679 |
| 2022 | $3,759 | $142,443 | $27,594 | $114,849 |
| 2021 | $3,595 | $130,111 | $23,129 | $106,982 |
| 2020 | $3,464 | $122,672 | $23,129 | $99,543 |
| 2019 | $3,334 | $117,978 | $20,944 | $97,034 |
| 2018 | $3,243 | $114,326 | $20,564 | $93,762 |
| 2017 | $3,233 | $113,585 | $20,659 | $92,926 |
| 2016 | $2,946 | $107,157 | $19,875 | $87,282 |
| 2015 | $2,988 | $108,502 | $18,640 | $89,862 |
| 2014 | $2,904 | $104,059 | $18,735 | $85,324 |
Source: Public Records
Map
Nearby Homes
- 2975 Rosewood Dr
- 726 Whitney Shoals Rd
- 800 Sparkleberry Rd
- 802 Sparkleberry Rd
- 4489 Woodberry Ct
- 4614 Stoneridge Ct
- 656 Deerwood Way
- 829 Woodberry Dr
- 14 Plantation Hills Dr
- 854 Sparkleberry Rd
- 646 Wellington Dr
- 4670 La Pointe
- 34 Plantation Hills Dr
- 787 Springbrook Cir
- 3465 Hilltop Trail
- 654 Whitney Shoals Rd
- 4136 Buffalo Trail
- 1 Woodbridge Cir
- 1 Wood Cir
- 4653 Washington Rd
- 4534 Ridgepine Ct
- 4536 Ridge Pine Ct
- 4532 Ridgepine Ct
- 4532 Ridge Pine Ct
- 957 Woody Hill Cir
- 4538 Ridge Pine Dr
- 4530 Ridge Pine Ct
- 4542 Ridge Pine Dr
- 4540 Ridge Pine Dr
- 4540 Ridge Pine Ct
- 4528 Ridge Pine Dr
- 654 Woodstone Way
- 4526 Ridge Pine Dr
- 4526 Ridgepine Dr
- 882 Lillian Park Dr
- 911 Lillian Park Dr
- 3190 Wayne Dr
- 900 Lillian Park Dr
- 877 Lillian Park Dr
- 605 Ridge Way