Estimated Value: $460,509 - $511,000
3
Beds
3
Baths
1,970
Sq Ft
$250/Sq Ft
Est. Value
About This Home
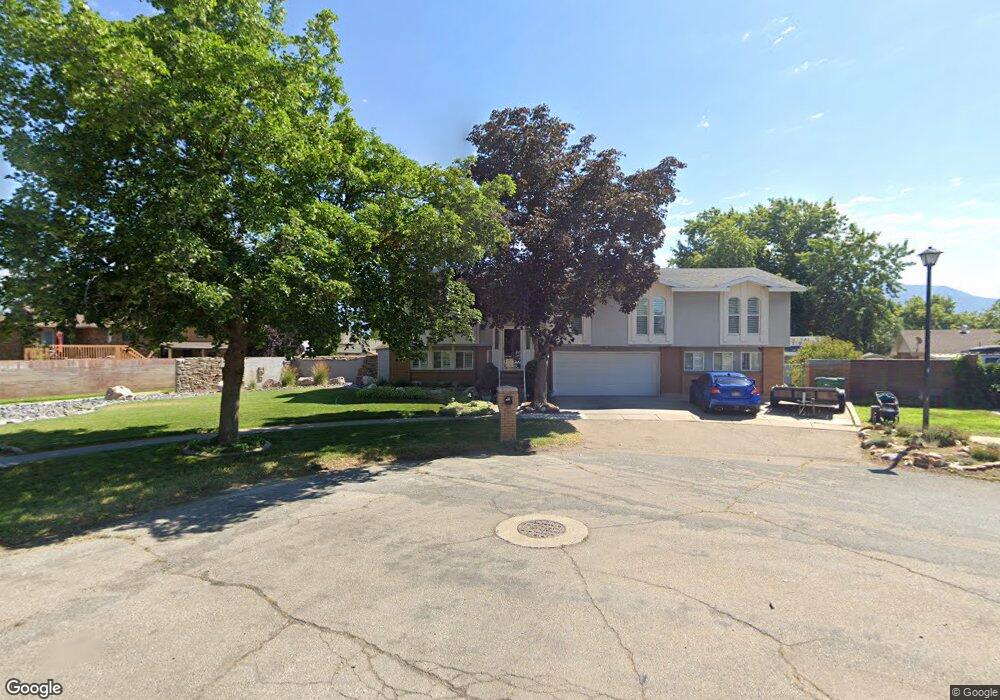
This home is located at 4534 S 1675 W, Roy, UT 84067 and is currently estimated at $493,127, approximately $250 per square foot. 4534 S 1675 W is a home located in Weber County with nearby schools including Valley View School, Sand Ridge Junior High School, and Roy High School.
Ownership History
Date
Name
Owned For
Owner Type
Purchase Details
Closed on
Apr 12, 2024
Sold by
Mumford Family Revocable Living Trust and Mumford Robert T
Bought by
Mumford Jeffrey W
Current Estimated Value
Purchase Details
Closed on
Jul 26, 2019
Sold by
Mumford Robert T and Mumford Colleen B
Bought by
Mumford Robert T and Mumford Colleen B
Purchase Details
Closed on
May 16, 2006
Sold by
Mumford Colleen B
Bought by
Mumford Colleen B and Mumford Robert T
Home Financials for this Owner
Home Financials are based on the most recent Mortgage that was taken out on this home.
Original Mortgage
$270,000
Interest Rate
6.51%
Mortgage Type
FHA
Create a Home Valuation Report for This Property
The Home Valuation Report is an in-depth analysis detailing your home's value as well as a comparison with similar homes in the area
Home Values in the Area
Average Home Value in this Area
Purchase History
| Date | Buyer | Sale Price | Title Company |
|---|---|---|---|
| Mumford Jeffrey W | -- | None Listed On Document | |
| Mumford Robert T | -- | None Available | |
| Mumford Colleen B | -- | Equity Title Production Faci |
Source: Public Records
Mortgage History
| Date | Status | Borrower | Loan Amount |
|---|---|---|---|
| Previous Owner | Mumford Colleen B | $270,000 | |
| Previous Owner | Mumford Colleen B | $270,000 |
Source: Public Records
Tax History
| Year | Tax Paid | Tax Assessment Tax Assessment Total Assessment is a certain percentage of the fair market value that is determined by local assessors to be the total taxable value of land and additions on the property. | Land | Improvement |
|---|---|---|---|---|
| 2025 | $3,027 | $486,027 | $156,258 | $329,769 |
| 2024 | $2,956 | $262,899 | $85,950 | $176,949 |
| 2023 | $2,881 | $256,850 | $82,904 | $173,946 |
| 2022 | $2,773 | $253,000 | $66,419 | $186,581 |
| 2021 | $2,373 | $357,000 | $85,568 | $271,432 |
| 2020 | $2,198 | $303,000 | $85,568 | $217,432 |
| 2019 | $2,182 | $284,000 | $50,389 | $233,611 |
| 2018 | $2,089 | $256,000 | $45,453 | $210,547 |
| 2017 | $1,953 | $224,000 | $45,453 | $178,547 |
| 2016 | $1,798 | $110,369 | $24,810 | $85,559 |
| 2015 | $1,720 | $108,419 | $22,094 | $86,325 |
| 2014 | $1,735 | $108,419 | $22,094 | $86,325 |
Source: Public Records
Map
Nearby Homes
- 4598 S Blossom Glen Way
- 4602 Hathaway Dr
- 4539 S 1800 W Unit 127
- 2015 W 4450 S
- 1765 W 5000 S
- 1838 W 5050 S
- 1818 W 5050 S
- 1198 W 4400 S Unit V
- 1198 W 4400 S Unit T
- 1805 W 5050 S
- 1789 W 5050 S
- 2015 W 4225 S
- 1781 W 5050 S
- 5092 S 1800 W
- 5131 S 1275 W
- 1959 3985 St S Unit 2
- 5124 S 1275 W
- 5125 S 1250 W
- 4256 S 1100 W
- 5161 S 1275 W
Your Personal Tour Guide
Ask me questions while you tour the home.