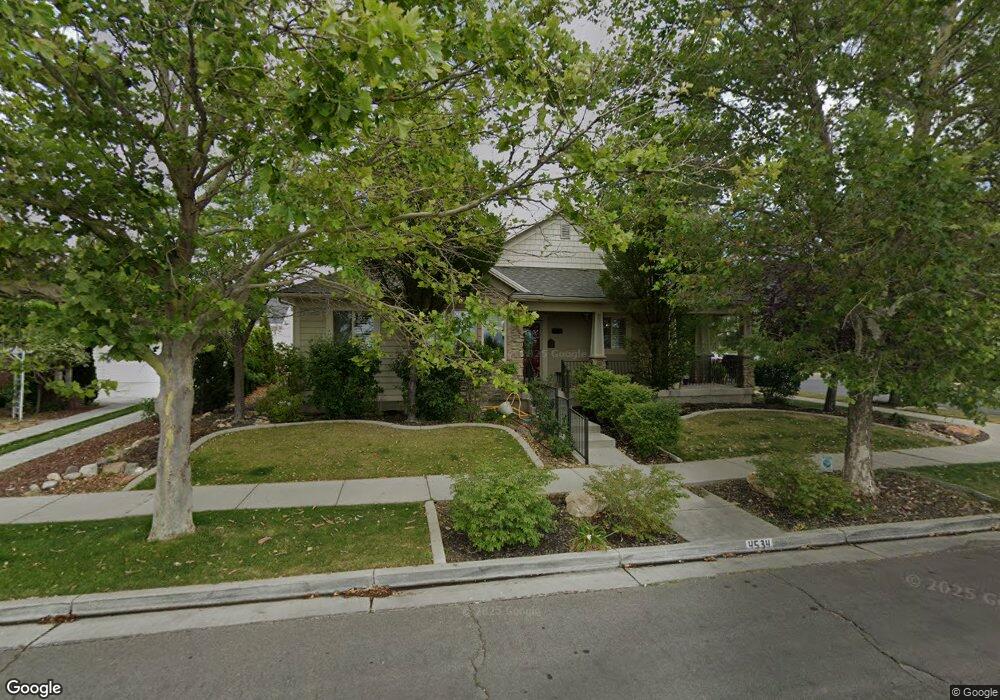
4534 W Kestrel Ridge Rd South Jordan, UT 84095
Daybreak NeighborhoodEstimated Value: $679,000 - $773,000
5
Beds
3
Baths
3,501
Sq Ft
$206/Sq Ft
Est. Value
About This Home
This home is located at 4534 W Kestrel Ridge Rd, South Jordan, UT 84095 and is currently estimated at $721,478, approximately $206 per square foot. 4534 W Kestrel Ridge Rd is a home located in Salt Lake County with nearby schools including Daybreak Elementary School, Mountain Creek Middle School, and Herriman High School.
Ownership History
Date
Name
Owned For
Owner Type
Purchase Details
Closed on
Apr 7, 2022
Sold by
Daniel Cook David and Daniel Mareen H
Bought by
Cook55 Trust
Current Estimated Value
Purchase Details
Closed on
Jun 2, 2015
Sold by
Ruff Robert W and Ruff Colleen T
Bought by
Cook David Daniel and Cook Mareen H
Purchase Details
Closed on
Dec 6, 2012
Sold by
Ruff Robert W and Ruff Colleen T
Bought by
Ruff Robert W and Ruff Colleen T
Purchase Details
Closed on
Oct 6, 2006
Sold by
Coombs Arthur F and Coombs Mignon P
Bought by
Ruff Robert W
Purchase Details
Closed on
Jul 21, 2005
Sold by
Coombs Arthur F and Coombs Mignon P
Bought by
Coombs Arthur F and Coombs Mignon P
Purchase Details
Closed on
Mar 22, 2005
Sold by
Bangerter Homes Llc
Bought by
Coombs Arthur F and Coombs Mignon P
Purchase Details
Closed on
Mar 1, 2004
Sold by
Kennecott Land Residential Development C
Bought by
Bangerter Homes Llc
Create a Home Valuation Report for This Property
The Home Valuation Report is an in-depth analysis detailing your home's value as well as a comparison with similar homes in the area
Home Values in the Area
Average Home Value in this Area
Purchase History
| Date | Buyer | Sale Price | Title Company |
|---|---|---|---|
| Cook55 Trust | -- | None Listed On Document | |
| Cook David Daniel | -- | Surety Title | |
| Ruff Robert W | -- | None Available | |
| Ruff Robert W | -- | Merrill Title | |
| Coombs Arthur F | -- | None Available | |
| Coombs Arthur F | -- | Merrill Title | |
| Bangerter Homes Llc | -- | First American Title |
Source: Public Records
Mortgage History
| Date | Status | Borrower | Loan Amount |
|---|---|---|---|
| Closed | Bangerter Homes Llc | $0 |
Source: Public Records
Tax History Compared to Growth
Tax History
| Year | Tax Paid | Tax Assessment Tax Assessment Total Assessment is a certain percentage of the fair market value that is determined by local assessors to be the total taxable value of land and additions on the property. | Land | Improvement |
|---|---|---|---|---|
| 2025 | $3,544 | $677,400 | $107,800 | $569,600 |
| 2024 | $3,544 | $672,900 | $104,600 | $568,300 |
| 2023 | $3,680 | $659,200 | $101,600 | $557,600 |
| 2022 | $3,802 | $667,500 | $99,600 | $567,900 |
| 2021 | $3,122 | $502,900 | $76,800 | $426,100 |
| 2020 | $2,959 | $446,800 | $72,300 | $374,500 |
| 2019 | $2,943 | $436,800 | $72,300 | $364,500 |
| 2018 | $2,821 | $416,600 | $71,200 | $345,400 |
| 2017 | $2,717 | $393,300 | $71,200 | $322,100 |
| 2016 | $2,846 | $390,400 | $71,200 | $319,200 |
| 2015 | $2,792 | $372,300 | $86,200 | $286,100 |
| 2014 | -- | $349,700 | $102,400 | $247,300 |
Source: Public Records
Map
Nearby Homes
- 4563 W Daybreak Rim Way
- 4584 W Daybreak Rim Way
- 4592 W Scissor Way
- 11347 S Kestrel Rise Rd
- 11211 S Clear Blue Dr
- 4555 W Open Hill Dr
- 4536 W Silent Rain Dr
- 11076 S Paddle Board Way
- 11213 S Kestrel Rise Rd
- 11064 S Paddle Board Way
- 11381 Skylux Ave
- 11048 S Paddle Board Way Unit 3-332
- 11171 S Kestrel Rise Rd
- 11491 Harvest Crest Way
- Ashland Plan at Cascade Village - Augustine
- Avenel Plan at Cascade Village - Augustine
- Camden Plan at Cascade Village - Augustine
- Sonoma Plan at Cascade Village - Augustine
- 11043 S Lake Island Dr Unit 3-377
- 11037 S Lake Island Dr Unit 3-378
- 4534 W Kestrel Rd
- 4534 Kestrel Ridge Rd
- 4544 W Kestrel Ridge Rd
- 4544 Kestrel Ridge Rd
- 11288 High Crest Ln
- 11288 S High Crest Ln
- 4522 W Kestrel Ridge Rd Unit 316
- 11293 S High Crest Ln
- 11293 S High Crest Ln Unit 317
- 4518 W Kestrel Ridge Rd Unit 315
- 4552 Kestrel Ridge Rd
- 4552 W Kestrel Ridge Rd
- 11282 S High Crest Ln
- 11282 High Crest Ln
- 11291 S High Crest Ln
- 4514 W Kestrel Ridge Rd Unit 314
- 11307 S Morning Tide Ln
- 11307 Morning Tide Ln
- 4512 W Kestrel Ridge Rd Unit 313
- 11267 S High Crest Ln