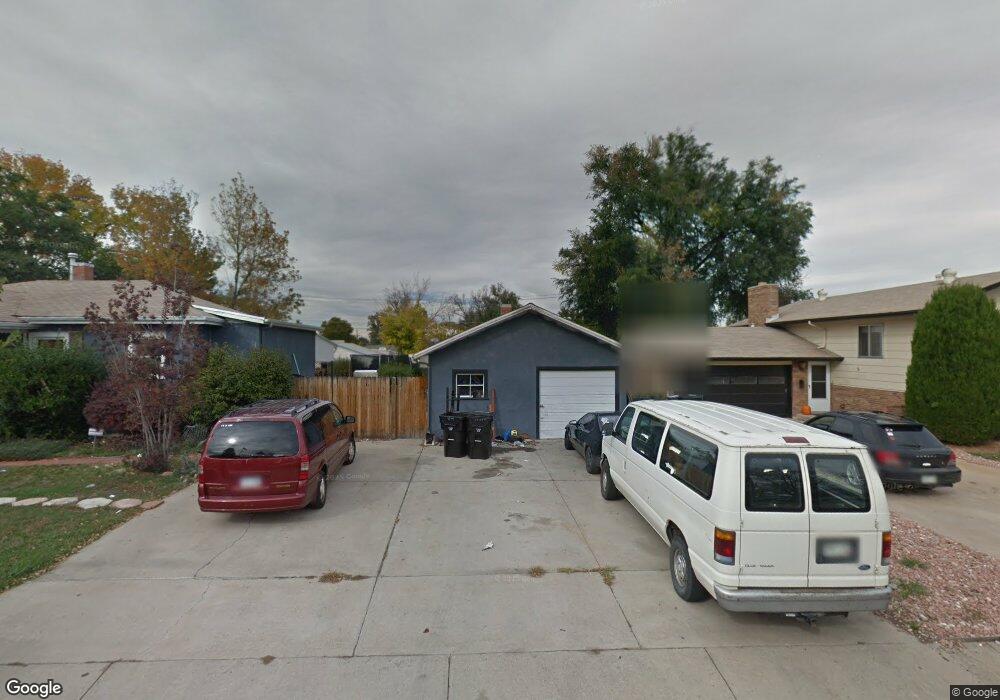
4535 W 4th Ave Denver, CO 80219
Barnum NeighborhoodEstimated Value: $552,000 - $603,000
4
Beds
2
Baths
1,848
Sq Ft
$312/Sq Ft
Est. Value
About This Home
This home is located at 4535 W 4th Ave, Denver, CO 80219 and is currently estimated at $577,205, approximately $312 per square foot. 4535 W 4th Ave is a home located in Denver County with nearby schools including Newlon Elementary School, Kepner Beacon Middle School, and West High School.
Ownership History
Date
Name
Owned For
Owner Type
Purchase Details
Closed on
Oct 5, 2015
Sold by
Montano Francisco R and Montano Jesus R
Bought by
Grigg Thomas and Healey Grigg Kendra
Current Estimated Value
Home Financials for this Owner
Home Financials are based on the most recent Mortgage that was taken out on this home.
Original Mortgage
$266,243
Outstanding Balance
$212,895
Interest Rate
4.37%
Mortgage Type
FHA
Estimated Equity
$364,310
Purchase Details
Closed on
Oct 1, 2014
Sold by
Montano Francisco R
Bought by
Montano Francisco R and Montano Jesus R
Purchase Details
Closed on
Nov 12, 2009
Sold by
Anthony Susan J
Bought by
Montano Francisco R
Home Financials for this Owner
Home Financials are based on the most recent Mortgage that was taken out on this home.
Original Mortgage
$186,558
Interest Rate
4.9%
Mortgage Type
FHA
Purchase Details
Closed on
Oct 25, 2006
Sold by
Anthony Susan J
Bought by
Anthony Susan J
Purchase Details
Closed on
Jan 26, 1995
Sold by
Anthony Alan
Bought by
Anthony Alan D and Anthony Susan J
Create a Home Valuation Report for This Property
The Home Valuation Report is an in-depth analysis detailing your home's value as well as a comparison with similar homes in the area
Home Values in the Area
Average Home Value in this Area
Purchase History
| Date | Buyer | Sale Price | Title Company |
|---|---|---|---|
| Grigg Thomas | $275,900 | None Available | |
| Montano Francisco R | -- | None Available | |
| Montano Francisco R | $191,000 | Security Title | |
| Anthony Susan J | -- | None Available | |
| Anthony Alan D | -- | -- |
Source: Public Records
Mortgage History
| Date | Status | Borrower | Loan Amount |
|---|---|---|---|
| Open | Grigg Thomas | $266,243 | |
| Previous Owner | Montano Francisco R | $186,558 |
Source: Public Records
Tax History Compared to Growth
Tax History
| Year | Tax Paid | Tax Assessment Tax Assessment Total Assessment is a certain percentage of the fair market value that is determined by local assessors to be the total taxable value of land and additions on the property. | Land | Improvement |
|---|---|---|---|---|
| 2024 | $3,476 | $43,890 | $7,470 | $36,420 |
| 2023 | $3,401 | $43,890 | $7,470 | $36,420 |
| 2022 | $3,086 | $38,810 | $9,260 | $29,550 |
| 2021 | $2,979 | $39,920 | $9,520 | $30,400 |
| 2020 | $2,445 | $32,950 | $8,930 | $24,020 |
| 2019 | $2,376 | $32,950 | $8,930 | $24,020 |
| 2018 | $2,380 | $30,760 | $8,990 | $21,770 |
| 2017 | $2,373 | $30,760 | $8,990 | $21,770 |
| 2016 | $1,805 | $22,130 | $5,970 | $16,160 |
| 2015 | $1,729 | $22,130 | $5,970 | $16,160 |
| 2014 | $1,275 | $15,350 | $3,980 | $11,370 |
Source: Public Records
Map
Nearby Homes
- 4565 W 4th Ave
- 4529 W 4th Ave
- 4595 W 4th Ave
- 4540 W Short Place
- 4560 W Short Place
- 4520 W Short Place
- 4525 W 4th Ave
- 4580 W Short Place
- 4601 W 4th Ave
- 4500 W Short Place
- 4600 W Short Place
- 4530 W 4th Ave
- 4620 W Short Place
- 4615 W 4th Ave
- 4541 W Short Place
- 4561 W Short Place
- 4581 W Short Place
- 4521 W Short Place
- 4520 W 4th Ave
- 4501 W Short Place