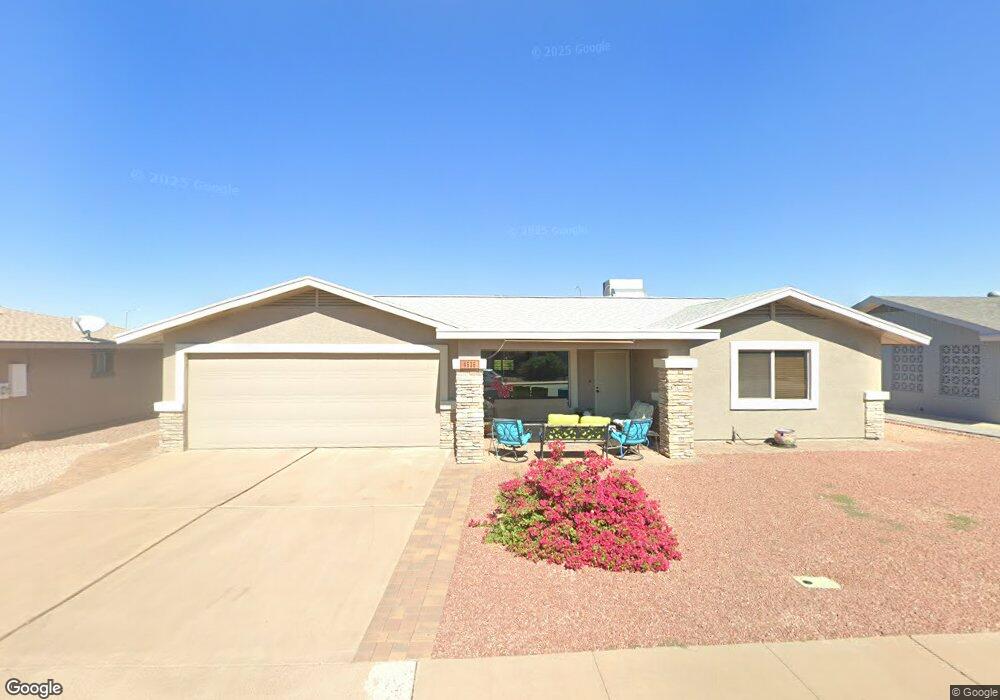
4536 E Dragoon Ave Mesa, AZ 85206
Sunland Village NeighborhoodEstimated Value: $316,010 - $358,000
2
Beds
1
Bath
1,078
Sq Ft
$313/Sq Ft
Est. Value
About This Home
This home is located at 4536 E Dragoon Ave, Mesa, AZ 85206 and is currently estimated at $337,753, approximately $313 per square foot. 4536 E Dragoon Ave is a home located in Maricopa County with nearby schools including Franklin at Brimhall Elementary School, Madison Elementary School, and Franklin West Elementary School.
Ownership History
Date
Name
Owned For
Owner Type
Purchase Details
Closed on
Sep 3, 2010
Sold by
Pratt Bryan E
Bought by
Pratt Carolyn A
Current Estimated Value
Purchase Details
Closed on
Aug 18, 2010
Sold by
Pratt Carolyn A
Bought by
Clark James W and Clark Russelyn J
Purchase Details
Closed on
Oct 16, 2006
Sold by
Konetzki Ann L
Bought by
Pratt Carolyn A
Purchase Details
Closed on
Aug 21, 2006
Sold by
Johnson Lorne K and Johnson Marlene V
Bought by
Johnson Lorne K and The Lorne K Johnson Trust
Purchase Details
Closed on
Sep 29, 1997
Sold by
Wade Marilyn K
Bought by
Wade Marilyn K and Frances H Weidinger Revocable Trust
Create a Home Valuation Report for This Property
The Home Valuation Report is an in-depth analysis detailing your home's value as well as a comparison with similar homes in the area
Home Values in the Area
Average Home Value in this Area
Purchase History
| Date | Buyer | Sale Price | Title Company |
|---|---|---|---|
| Pratt Carolyn A | -- | First American Title Ins Co | |
| Clark James W | $115,000 | First American Title Ins Co | |
| Pratt Carolyn A | -- | None Available | |
| Johnson Lorne K | -- | None Available | |
| Wade Marilyn K | -- | -- | |
| Wade Marilyn K | -- | -- |
Source: Public Records
Tax History
| Year | Tax Paid | Tax Assessment Tax Assessment Total Assessment is a certain percentage of the fair market value that is determined by local assessors to be the total taxable value of land and additions on the property. | Land | Improvement |
|---|---|---|---|---|
| 2025 | $1,376 | $13,649 | -- | -- |
| 2024 | $1,176 | $12,999 | -- | -- |
| 2023 | $1,176 | $25,960 | $5,190 | $20,770 |
| 2022 | $1,151 | $15,370 | $3,070 | $12,300 |
| 2021 | $1,176 | $15,370 | $3,070 | $12,300 |
| 2020 | $1,160 | $14,380 | $2,870 | $11,510 |
| 2019 | $1,077 | $12,980 | $2,590 | $10,390 |
| 2018 | $1,027 | $11,880 | $2,370 | $9,510 |
| 2017 | $995 | $11,020 | $2,200 | $8,820 |
| 2016 | $972 | $10,300 | $2,060 | $8,240 |
| 2015 | $921 | $9,060 | $1,810 | $7,250 |
Source: Public Records
Map
Nearby Homes
- 4620 E Dragoon Ave
- 515 S Parkcrest Unit 532
- 4502 E Carol Ave Unit 1
- 4604 E Crescent Ave
- 4655 E Delta Ave
- 4706 E Capri Ave
- 4363 E Dragoon Cir
- 730 S Portland
- 425 S Parkcrest Unit 343
- 425 S Parkcrest Unit 322
- 4327 E Catalina Cir
- 440 S Parkcrest Unit 138
- 440 S Parkcrest Unit 145
- 4329 E Capri Ave Unit 222
- 4328 E Capri Ave Unit 163
- 520 S Greenfield Rd Unit 39
- 520 S Greenfield Rd Unit 17
- 520 S Greenfield Rd Unit 13
- 520 S Greenfield Rd Unit 30
- 418 S Roanoke
- 4544 E Dragoon Ave
- 4535 E Catalina Ave
- 4543 E Catalina Ave
- 4529 E Catalina Ave
- 4550 E Dragoon Ave
- 4537 E Dragoon Ave
- 4522 E Dragoon Ave
- 4531 E Dragoon Ave
- 4545 E Dragoon Ave
- 4549 E Catalina Ave
- 4523 E Catalina Ave
- 4551 E Dragoon Ave
- 4558 E Dragoon Ave
- 4512 E Dragoon Ave
- 4538 E Dolphin Ave
- 4534 E Catalina Ave
- 4557 E Catalina Ave
- 4515 E Catalina Ave
- 4542 E Catalina Ave
- 4532 E Dolphin Ave
Your Personal Tour Guide
Ask me questions while you tour the home.