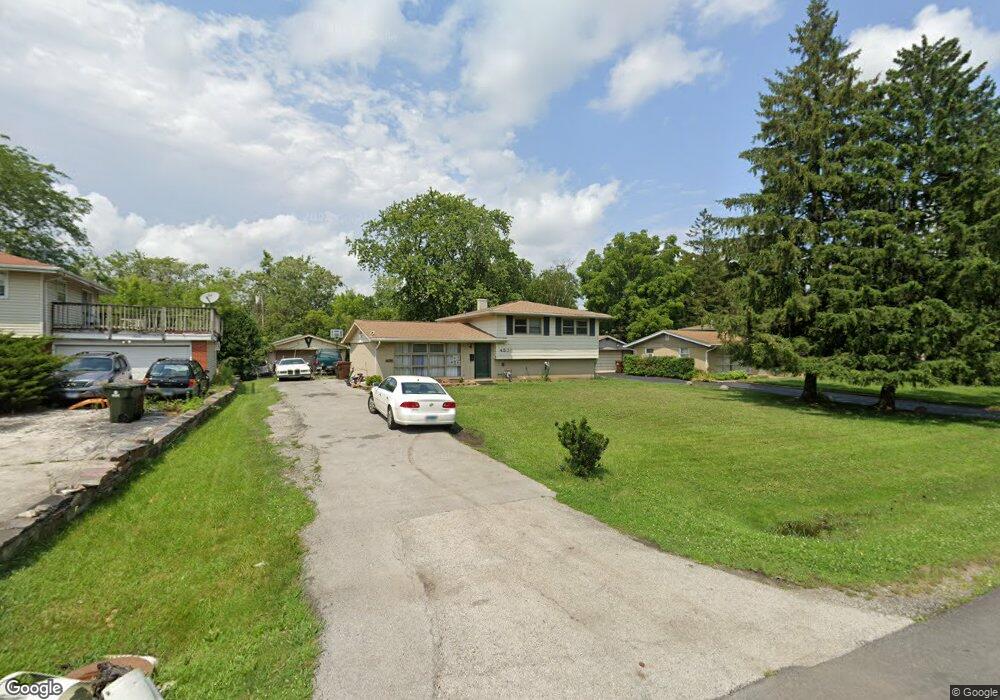
4536 Flossmoor Rd Country Club Hills, IL 60478
Estimated Value: $163,000 - $213,522
3
Beds
2
Baths
1,135
Sq Ft
$163/Sq Ft
Est. Value
About This Home
This home is located at 4536 Flossmoor Rd, Country Club Hills, IL 60478 and is currently estimated at $185,381, approximately $163 per square foot. 4536 Flossmoor Rd is a home located in Cook County with nearby schools including Zenon J Sykuta School, Meadowview Intermediate School, and Southwood Middle School.
Ownership History
Date
Name
Owned For
Owner Type
Purchase Details
Closed on
Jul 2, 2020
Sold by
Johnson James B
Bought by
Johnson James B and James B Johnson Living Trust
Current Estimated Value
Purchase Details
Closed on
May 2, 2008
Sold by
Washington Mutual Bank
Bought by
Johnson James B
Home Financials for this Owner
Home Financials are based on the most recent Mortgage that was taken out on this home.
Original Mortgage
$107,100
Interest Rate
6.05%
Mortgage Type
Unknown
Purchase Details
Closed on
Jan 10, 2008
Sold by
Philpotts Mario
Bought by
Washington Mutual Bank and Long Beach Mortgage Co
Purchase Details
Closed on
Jun 8, 2005
Sold by
Nelson Lawrence E and Nelson Paulette S
Bought by
Philpotts Mario
Home Financials for this Owner
Home Financials are based on the most recent Mortgage that was taken out on this home.
Original Mortgage
$136,000
Interest Rate
7.35%
Mortgage Type
Unknown
Create a Home Valuation Report for This Property
The Home Valuation Report is an in-depth analysis detailing your home's value as well as a comparison with similar homes in the area
Home Values in the Area
Average Home Value in this Area
Purchase History
| Date | Buyer | Sale Price | Title Company |
|---|---|---|---|
| Johnson James B | -- | Attorney | |
| Johnson James B | $119,000 | Ticor Title Insurance Co | |
| Washington Mutual Bank | -- | None Available | |
| Philpotts Mario | $170,000 | Pntn |
Source: Public Records
Mortgage History
| Date | Status | Borrower | Loan Amount |
|---|---|---|---|
| Previous Owner | Johnson James B | $107,100 | |
| Previous Owner | Philpotts Mario | $136,000 |
Source: Public Records
Tax History Compared to Growth
Tax History
| Year | Tax Paid | Tax Assessment Tax Assessment Total Assessment is a certain percentage of the fair market value that is determined by local assessors to be the total taxable value of land and additions on the property. | Land | Improvement |
|---|---|---|---|---|
| 2024 | $3,843 | $7,034 | $2,430 | $4,604 |
| 2023 | $3,956 | $7,034 | $2,430 | $4,604 |
| 2022 | $3,956 | $5,103 | $1,671 | $3,432 |
| 2021 | $3,976 | $5,102 | $1,670 | $3,432 |
| 2020 | $3,970 | $5,102 | $1,670 | $3,432 |
| 2019 | $3,248 | $4,092 | $1,518 | $2,574 |
| 2018 | $3,081 | $4,092 | $1,518 | $2,574 |
| 2017 | $2,990 | $4,092 | $1,518 | $2,574 |
| 2016 | $2,614 | $3,693 | $1,366 | $2,327 |
| 2015 | $2,553 | $3,693 | $1,366 | $2,327 |
| 2014 | $2,507 | $3,693 | $1,366 | $2,327 |
| 2013 | $2,559 | $4,152 | $1,366 | $2,786 |
Source: Public Records
Map
Nearby Homes
- 19011 Loretto Ln
- 19020 John Ave
- 4531 189th St
- 18840 Loretto Ln
- 4601 188th St
- 4422 189th St
- 18741 Cicero Ave
- 18740 John Ave
- 4843 Turner Ct
- 4251 190th Place
- 19128 Pine Dr Unit 120
- 19208 Pine Dr Unit 204
- 19135 Pine Dr Unit 2
- 4147 191st Ct Unit 101
- 4112 192nd Ct Unit 209
- 4177 192nd Ct Unit 244
- 4215 188th St
- 4141 191st Ct Unit 79
- 4143 192nd Ct Unit 225
- 4128 192nd Ct Unit 221
- 4536 Flossmoor Rd
- 4542 Flossmoor Rd
- 4530 Flossmoor Rd
- 19061 Loretto Ln
- 19051 Loretto Ln
- 19060 John Ave
- 19041 Loretto Ln
- 19041 Loretto Ln
- 19040 John Ave
- 19031 Loretto Ln
- 19031 Loretto Ln
- 4600 Flossmoor Rd
- 19060 Loretto Ln
- 19021 Loretto Ln
- 19021 Loretto Ln
- 4518 Flossmoor Rd
- 19030 John Ave
- 19051 John Ave
- 19040 Loretto Ln
- 19050 Loretto Ln