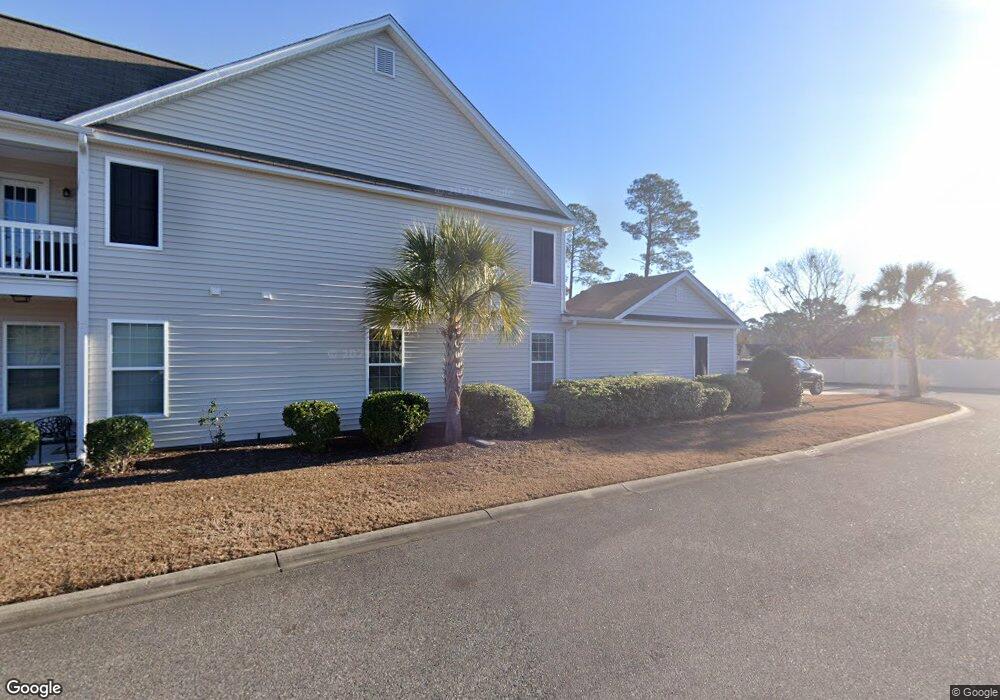
4536 Livorn Loop Myrtle Beach, SC 29579
Estimated Value: $319,000 - $369,000
4
Beds
4
Baths
2,057
Sq Ft
$170/Sq Ft
Est. Value
About This Home
This home is located at 4536 Livorn Loop, Myrtle Beach, SC 29579 and is currently estimated at $350,692, approximately $170 per square foot. 4536 Livorn Loop is a home located in Horry County with nearby schools including River Oaks Elementary School, Ten Oaks Middle, and Carolina Forest High School.
Ownership History
Date
Name
Owned For
Owner Type
Purchase Details
Closed on
Jun 3, 2020
Sold by
Doris Joseph L
Bought by
Miller Brandyn S and Miller Ladonna E
Current Estimated Value
Home Financials for this Owner
Home Financials are based on the most recent Mortgage that was taken out on this home.
Original Mortgage
$171,999
Outstanding Balance
$152,748
Interest Rate
3.3%
Mortgage Type
New Conventional
Estimated Equity
$197,944
Purchase Details
Closed on
Oct 15, 2019
Sold by
Veterans Affairs
Bought by
Doris Joseph L and Long Michelle K
Home Financials for this Owner
Home Financials are based on the most recent Mortgage that was taken out on this home.
Original Mortgage
$148,000
Interest Rate
3.7%
Mortgage Type
New Conventional
Purchase Details
Closed on
Jun 10, 2019
Sold by
Freedom Mortgage Corp
Bought by
Veterans Affairs
Purchase Details
Closed on
May 29, 2019
Sold by
Vanslyke Curtis Edward
Bought by
Freedom Mortgage Corp
Purchase Details
Closed on
Jan 17, 2014
Sold by
D R Horton Inc
Bought by
Vanslyke Curtis Edward
Create a Home Valuation Report for This Property
The Home Valuation Report is an in-depth analysis detailing your home's value as well as a comparison with similar homes in the area
Home Values in the Area
Average Home Value in this Area
Purchase History
| Date | Buyer | Sale Price | Title Company |
|---|---|---|---|
| Miller Brandyn S | $214,999 | -- | |
| Doris Joseph L | $185,000 | -- | |
| Veterans Affairs | -- | -- | |
| Freedom Mortgage Corp | -- | -- | |
| Vanslyke Curtis Edward | $178,503 | -- |
Source: Public Records
Mortgage History
| Date | Status | Borrower | Loan Amount |
|---|---|---|---|
| Open | Miller Brandyn S | $171,999 | |
| Previous Owner | Doris Joseph L | $148,000 |
Source: Public Records
Tax History Compared to Growth
Tax History
| Year | Tax Paid | Tax Assessment Tax Assessment Total Assessment is a certain percentage of the fair market value that is determined by local assessors to be the total taxable value of land and additions on the property. | Land | Improvement |
|---|---|---|---|---|
| 2024 | $984 | $19,580 | $5,400 | $14,180 |
| 2023 | $984 | $12,696 | $2,568 | $10,128 |
| 2021 | $2,791 | $12,696 | $2,568 | $10,128 |
| 2020 | $2,649 | $12,696 | $2,568 | $10,128 |
| 2019 | $2,563 | $12,696 | $2,568 | $10,128 |
| 2018 | $2,316 | $10,680 | $1,872 | $8,808 |
| 2017 | $2,301 | $10,680 | $1,872 | $8,808 |
| 2016 | -- | $10,680 | $1,872 | $8,808 |
| 2015 | $2,301 | $10,680 | $1,872 | $8,808 |
| 2014 | $1,975 | $9,468 | $1,872 | $7,596 |
Source: Public Records
Map
Nearby Homes
- 4070 Halyard Way Unit MB
- 5344 Grosseto Way
- 4059 Long Line Ln
- 4380 Livorn Loop Unit 4380
- 377 Vintage Cir
- 4258 Summit Trail
- 4368 Livorn Loop Unit 4368
- 4246 Livorn Loop
- 4348 Livorn Loop Unit 4348
- 4280 Hunting Bow Trail
- 336 Vintage Cir
- 4336 Summit Trail Unit MB
- 817 Arezzo Way Unit 1001 - Brookhaven
- 746 Gumbo Limbo Ln
- 5048 Prato Loop Unit 5048
- 950 Forestbrook Rd Unit C-3
- 3334 Volterra Way Unit 3334
- 4535 Tarpon Bay Rd
- 5231 Casentino Ct
- 875 Brookline Dr
- 4536 Livorn Loop Unit 905
- 4536 Livorn Loop Unit 4536
- 4540 Livorn Loop Unit 904
- 4544 Livorn Loop Unit Hamlin 0903
- 4548 Livorn Loop Unit Hamlin 0902
- 4552 Livorn Loop Unit Ralston 0901
- 4552 Livorn Loop
- 4552 Livorn Loop Unit B
- 4528 Livorn Loop Unit Savona Lot 01
- 4528 Livorn Loop
- 4528 Livorn Loop Unit lot 01
- 4528 Livorn Loop Unit 4528
- 4524 Livorn Loop Unit 2
- 4556 Livorn Loop
- 4556 Livorn Loop Unit 805
- 4560 Livorn Loop Unit 804
- 4560 Livorn Loop
- 4560 Livorn Loop Unit 10804
- 4560 Livorn Loop Unit 4560
- 4564 Livorn Loop Unit 4564