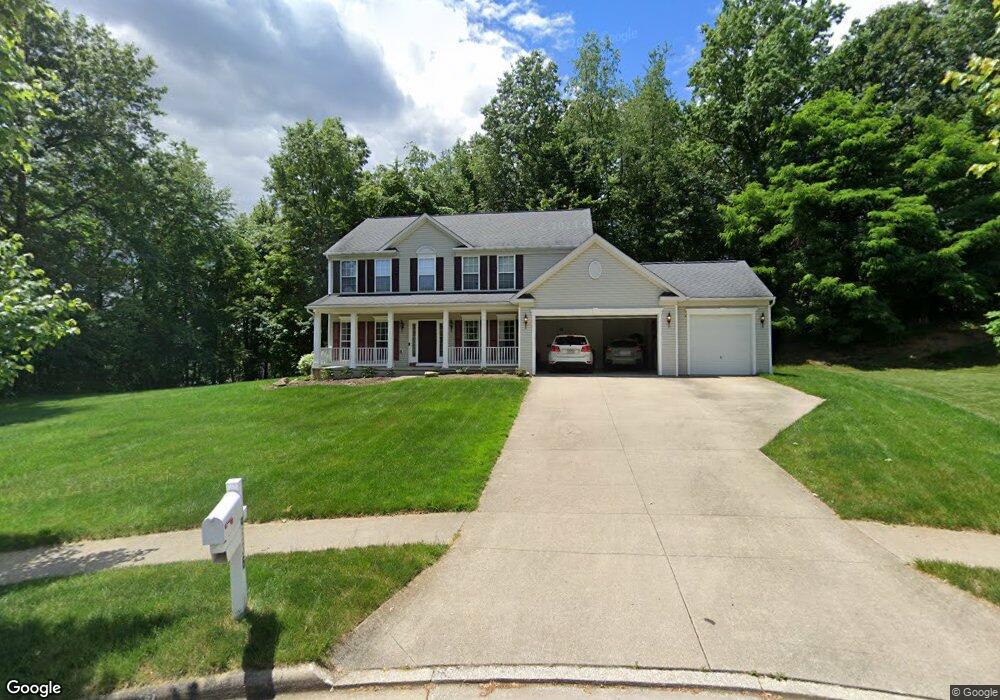
4536 Twickingham Cir Uniontown, OH 44685
Estimated Value: $487,000 - $565,000
4
Beds
3
Baths
2,768
Sq Ft
$186/Sq Ft
Est. Value
About This Home
This home is located at 4536 Twickingham Cir, Uniontown, OH 44685 and is currently estimated at $515,544, approximately $186 per square foot. 4536 Twickingham Cir is a home located in Summit County with nearby schools including Greenwood Elementary School, Green Intermediate Elementary School, and Green Primary School.
Ownership History
Date
Name
Owned For
Owner Type
Purchase Details
Closed on
Sep 7, 2007
Sold by
Nvr Inc
Bought by
Sorm Christopher A and Sorm Ellen M
Current Estimated Value
Home Financials for this Owner
Home Financials are based on the most recent Mortgage that was taken out on this home.
Original Mortgage
$253,090
Outstanding Balance
$159,581
Interest Rate
6.49%
Mortgage Type
Purchase Money Mortgage
Estimated Equity
$355,963
Purchase Details
Closed on
Jul 10, 2007
Sold by
Green Land Trust Ltd
Bought by
Nvr Inc and Ryan Homes
Home Financials for this Owner
Home Financials are based on the most recent Mortgage that was taken out on this home.
Original Mortgage
$253,090
Outstanding Balance
$159,581
Interest Rate
6.49%
Mortgage Type
Purchase Money Mortgage
Estimated Equity
$355,963
Create a Home Valuation Report for This Property
The Home Valuation Report is an in-depth analysis detailing your home's value as well as a comparison with similar homes in the area
Home Values in the Area
Average Home Value in this Area
Purchase History
| Date | Buyer | Sale Price | Title Company |
|---|---|---|---|
| Sorm Christopher A | $253,090 | Nvr Title Agency Llc | |
| Nvr Inc | $45,000 | Cornerstone Real Estate Titl |
Source: Public Records
Mortgage History
| Date | Status | Borrower | Loan Amount |
|---|---|---|---|
| Open | Sorm Christopher A | $253,090 |
Source: Public Records
Tax History Compared to Growth
Tax History
| Year | Tax Paid | Tax Assessment Tax Assessment Total Assessment is a certain percentage of the fair market value that is determined by local assessors to be the total taxable value of land and additions on the property. | Land | Improvement |
|---|---|---|---|---|
| 2025 | $8,053 | $151,050 | $46,960 | $104,090 |
| 2024 | $8,053 | $151,050 | $46,960 | $104,090 |
| 2023 | $8,053 | $151,050 | $46,960 | $104,090 |
| 2022 | $6,985 | $114,429 | $35,574 | $78,855 |
| 2021 | $6,964 | $114,429 | $35,574 | $78,855 |
| 2020 | $6,946 | $114,430 | $35,570 | $78,860 |
| 2019 | $5,230 | $84,830 | $20,460 | $64,370 |
| 2018 | $5,450 | $84,830 | $20,460 | $64,370 |
| 2017 | $4,902 | $84,830 | $20,460 | $64,370 |
| 2016 | $4,615 | $75,550 | $20,460 | $55,090 |
| 2015 | $4,902 | $75,550 | $20,460 | $55,090 |
| 2014 | $5,098 | $75,550 | $20,460 | $55,090 |
| 2013 | $5,128 | $79,820 | $20,460 | $59,360 |
Source: Public Records
Map
Nearby Homes
- 683 Chilham Cir
- 4441 Merlin Dr
- 4529-4533 Camelot Cir
- 4259 Arlington Rd
- 4710 Pinecrest Dr
- 4881 S Main St
- 3 Shrakes Hotel Dr
- 4 Shrakes Hotel Dr
- 6 Shrakes Hotel Dr
- 5 Shrakes Hotel Dr
- 7 Shrakes Hotel Dr
- 4674 S Main St
- 4298 S Main St Unit 4302
- S/L 14,15 Shakes Hotel Dr
- 1008 Dalby Cir
- 0 Kenway Blvd Unit 5162986
- lot 8 Whyem Dr
- 3630 Great Windsor Ln
- 3680 Kenway Blvd
- 3943 Crest View Dr
- 4528 Twickingham Cir
- 625 Chilham Cir
- 635 Chilham Cir
- 617 Chilham Cir
- 615 Chilham Cir
- 4527 Twickingham Cir
- 4535 Twickingham Cir
- 4047 Donegal Cir
- 609 Chilham Cir
- 4055 Donegal Cir
- 4035 Donegal Cir
- 4021 Donegal Cir
- 552 Amberley Dr
- 560 Amberley Dr
- 4063 Donegal Cir
- 568 Amberley Dr
- 630 Chilham Cir
- 622 Chilham Cir
- 601 Chilham Cir
- 638 Chilham Cir