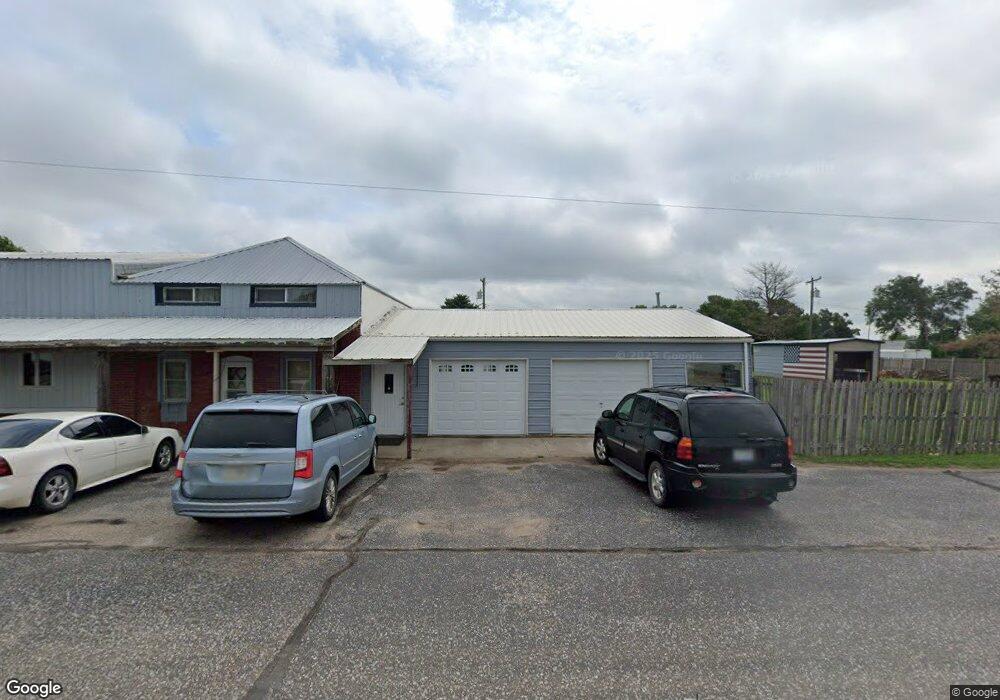
45376 Elm St Cornlea, NE 68642
Estimated Value: $164,000 - $922,000
--
Bed
--
Bath
5,128
Sq Ft
$75/Sq Ft
Est. Value
About This Home
This home is located at 45376 Elm St, Cornlea, NE 68642 and is currently estimated at $383,929, approximately $74 per square foot. 45376 Elm St is a home with nearby schools including Humphrey Elementary School, Lindsay Attendance Center, and Humphrey Junior/Senior High School.
Ownership History
Date
Name
Owned For
Owner Type
Purchase Details
Closed on
Nov 23, 2022
Sold by
Pfeifer Leander L and Pfeifer Stacey E
Bought by
Pfeifer Leander L and Pfeifer Stacey E
Current Estimated Value
Home Financials for this Owner
Home Financials are based on the most recent Mortgage that was taken out on this home.
Original Mortgage
$45,000
Outstanding Balance
$43,507
Interest Rate
6.58%
Estimated Equity
$340,422
Purchase Details
Closed on
Oct 30, 2009
Sold by
Bender Gary and Bender Christine
Bought by
Pfeifer Leander
Create a Home Valuation Report for This Property
The Home Valuation Report is an in-depth analysis detailing your home's value as well as a comparison with similar homes in the area
Home Values in the Area
Average Home Value in this Area
Purchase History
| Date | Buyer | Sale Price | Title Company |
|---|---|---|---|
| Pfeifer Leander L | -- | None Listed On Document | |
| Pfeifer Leander | $110,000 | -- |
Source: Public Records
Mortgage History
| Date | Status | Borrower | Loan Amount |
|---|---|---|---|
| Open | Pfeifer Leander L | $45,000 |
Source: Public Records
Tax History Compared to Growth
Tax History
| Year | Tax Paid | Tax Assessment Tax Assessment Total Assessment is a certain percentage of the fair market value that is determined by local assessors to be the total taxable value of land and additions on the property. | Land | Improvement |
|---|---|---|---|---|
| 2024 | $441 | $111,630 | $2,010 | $109,620 |
| 2023 | $700 | $111,630 | $2,010 | $109,620 |
| 2022 | $585 | $86,775 | $2,010 | $84,765 |
| 2021 | $582 | $86,775 | $2,010 | $84,765 |
| 2020 | $607 | $86,775 | $2,010 | $84,765 |
| 2019 | $564 | $83,770 | $2,010 | $81,760 |
| 2018 | $566 | $83,770 | $2,010 | $81,760 |
| 2017 | $451 | $69,300 | $2,010 | $67,290 |
| 2016 | $455 | $69,300 | $2,010 | $67,290 |
| 2015 | $460 | $69,300 | $2,010 | $67,290 |
| 2014 | $322 | $69,300 | $2,010 | $67,290 |
| 2012 | -- | $63,700 | $2,010 | $61,690 |
Source: Public Records
Map
Nearby Homes