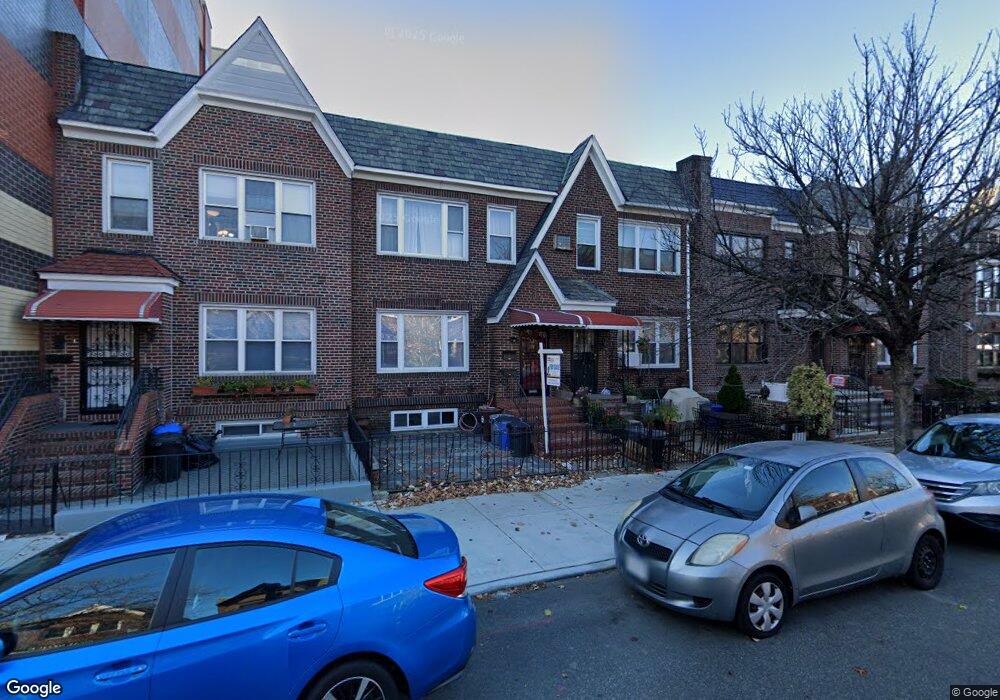
4538 43rd St Sunnyside, NY 11104
Sunnyside NeighborhoodEstimated Value: $1,171,039 - $1,769,000
--
Bed
--
Bath
2,447
Sq Ft
$594/Sq Ft
Est. Value
About This Home
This home is located at 4538 43rd St, Sunnyside, NY 11104 and is currently estimated at $1,454,510, approximately $594 per square foot. 4538 43rd St is a home located in Queens County with nearby schools including The Children's Lab School, Long Island City High School, and Razi School.
Ownership History
Date
Name
Owned For
Owner Type
Purchase Details
Closed on
Mar 4, 2015
Sold by
Tsering Nyima
Bought by
Thundu Nima and Tsering Nyima
Current Estimated Value
Home Financials for this Owner
Home Financials are based on the most recent Mortgage that was taken out on this home.
Original Mortgage
$119,994
Outstanding Balance
$91,089
Interest Rate
3.6%
Mortgage Type
New Conventional
Estimated Equity
$1,363,421
Purchase Details
Closed on
Mar 2, 2007
Sold by
Cullen Gemma
Bought by
Tsering Nyima
Home Financials for this Owner
Home Financials are based on the most recent Mortgage that was taken out on this home.
Original Mortgage
$573,750
Interest Rate
6.4%
Mortgage Type
Purchase Money Mortgage
Purchase Details
Closed on
Jan 20, 1999
Sold by
Orsini Margaret
Bought by
Cullen Gemma
Create a Home Valuation Report for This Property
The Home Valuation Report is an in-depth analysis detailing your home's value as well as a comparison with similar homes in the area
Home Values in the Area
Average Home Value in this Area
Purchase History
| Date | Buyer | Sale Price | Title Company |
|---|---|---|---|
| Thundu Nima | -- | -- | |
| Tsering Nyima | $765,000 | -- | |
| Tsering Nyima | $765,000 | -- | |
| Cullen Gemma | -- | First American Title Ins Co | |
| Cullen Gemma | -- | First American Title Ins Co |
Source: Public Records
Mortgage History
| Date | Status | Borrower | Loan Amount |
|---|---|---|---|
| Open | Thundu Nima | $119,994 | |
| Previous Owner | Tsering Nyima | $573,750 |
Source: Public Records
Tax History Compared to Growth
Tax History
| Year | Tax Paid | Tax Assessment Tax Assessment Total Assessment is a certain percentage of the fair market value that is determined by local assessors to be the total taxable value of land and additions on the property. | Land | Improvement |
|---|---|---|---|---|
| 2025 | $9,554 | $51,905 | $9,155 | $42,750 |
| 2024 | $9,566 | $48,968 | $8,404 | $40,564 |
| 2023 | $9,514 | $48,769 | $7,334 | $41,435 |
| 2022 | $9,414 | $87,540 | $15,240 | $72,300 |
| 2021 | $9,353 | $78,240 | $15,240 | $63,000 |
| 2020 | $8,860 | $85,980 | $15,240 | $70,740 |
| 2019 | $8,244 | $87,180 | $15,240 | $71,940 |
| 2018 | $7,987 | $40,641 | $8,992 | $31,649 |
| 2017 | $7,956 | $40,497 | $9,891 | $30,606 |
| 2016 | $7,328 | $40,497 | $9,891 | $30,606 |
| 2015 | $4,388 | $36,045 | $9,173 | $26,872 |
| 2014 | $4,388 | $34,006 | $9,677 | $24,329 |
Source: Public Records
Map
Nearby Homes
- 45-47 43rd St
- 43-18 Greenpoint Ave
- 4520 43rd St Unit 2C
- 45-20 43rd St Unit 1D
- 4805 42nd St Unit 5G
- 45-14 43rd St Unit 2D
- 45-14 43rd St Unit 3E
- 4720 42nd St Unit 4C
- 45-32 41st St
- 41-02 Queens Blvd Unit 4E
- 41-02 Queens Blvd Unit 5-E
- 47-37 45th St Unit 2A
- 48-41 43rd St Unit 5F
- 43-13 Queens Blvd
- 43-10 48th Ave Unit 2A
- 43-10 48th Ave Unit 2P
- 43-10 48th Ave Unit . 2J
- 4310 48th Ave Unit 2A
- 4310 48th Ave Unit 2F
- 47-25 40th St Unit 2C