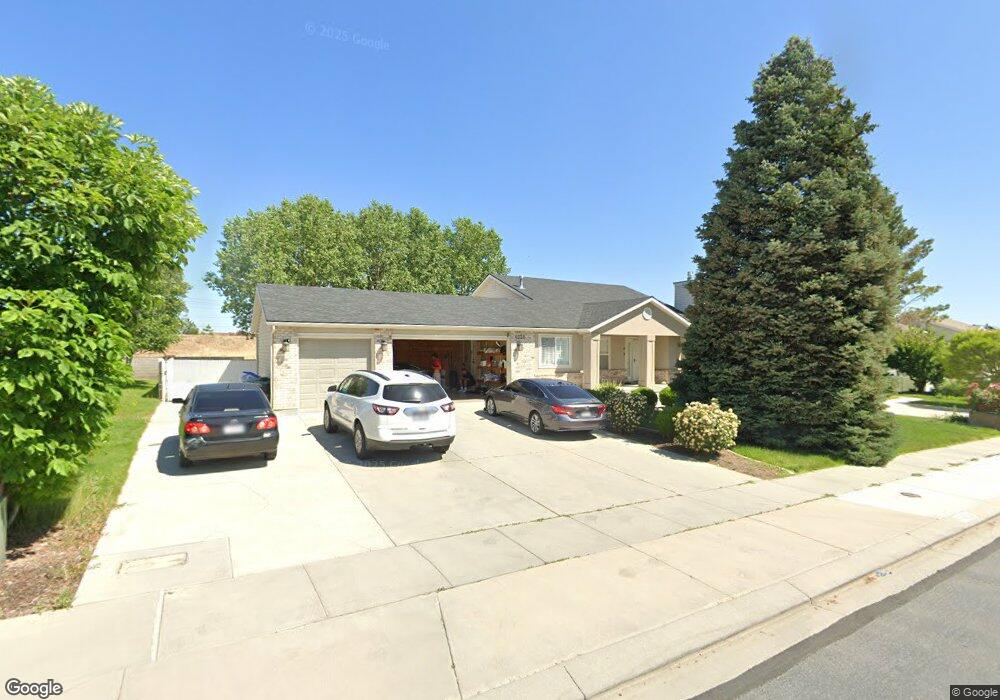
4538 Bingham Park Dr West Jordan, UT 84088
Jordan Oaks NeighborhoodEstimated Value: $649,000 - $714,000
6
Beds
3
Baths
1,412
Sq Ft
$475/Sq Ft
Est. Value
About This Home
This home is located at 4538 Bingham Park Dr, West Jordan, UT 84088 and is currently estimated at $671,377, approximately $475 per square foot. 4538 Bingham Park Dr is a home located in Salt Lake County with nearby schools including Terra Linda Elementary School, Elk Ridge Middle School, and Itineris Early College High School.
Ownership History
Date
Name
Owned For
Owner Type
Purchase Details
Closed on
Apr 29, 2025
Sold by
Boulard 2324 Trust and Boulard Dustin R
Bought by
Garcia Modesta Vazquez and Tenanguenono Fructuoso Vazquez
Current Estimated Value
Home Financials for this Owner
Home Financials are based on the most recent Mortgage that was taken out on this home.
Original Mortgage
$556,000
Outstanding Balance
$554,039
Interest Rate
6.67%
Mortgage Type
New Conventional
Estimated Equity
$117,338
Purchase Details
Closed on
Feb 26, 2019
Sold by
Boulard Dustin and Boulard Jami
Bought by
Boulard Dustin R and Boulard Jami M
Purchase Details
Closed on
May 11, 2006
Sold by
Peters Todd R and Peters Rebecca
Bought by
Boulard Dustin and Boulard Jami
Home Financials for this Owner
Home Financials are based on the most recent Mortgage that was taken out on this home.
Original Mortgage
$37,200
Interest Rate
5.96%
Mortgage Type
Stand Alone Second
Purchase Details
Closed on
Mar 29, 1996
Sold by
Pulte Home Corp
Bought by
Peters Todd R and Peters Rebecca
Home Financials for this Owner
Home Financials are based on the most recent Mortgage that was taken out on this home.
Original Mortgage
$135,400
Interest Rate
6.98%
Mortgage Type
FHA
Create a Home Valuation Report for This Property
The Home Valuation Report is an in-depth analysis detailing your home's value as well as a comparison with similar homes in the area
Home Values in the Area
Average Home Value in this Area
Purchase History
| Date | Buyer | Sale Price | Title Company |
|---|---|---|---|
| Garcia Modesta Vazquez | -- | Truly Title | |
| Garcia Modesta Vazquez | -- | Truly Title | |
| Boulard Dustin R | -- | Accommodation | |
| Boulard Dustin | -- | None Available | |
| Peters Todd R | -- | -- |
Source: Public Records
Mortgage History
| Date | Status | Borrower | Loan Amount |
|---|---|---|---|
| Open | Garcia Modesta Vazquez | $556,000 | |
| Closed | Garcia Modesta Vazquez | $556,000 | |
| Previous Owner | Boulard Dustin | $37,200 | |
| Previous Owner | Boulard Dustin | $198,400 | |
| Previous Owner | Peters Todd R | $135,400 |
Source: Public Records
Tax History Compared to Growth
Tax History
| Year | Tax Paid | Tax Assessment Tax Assessment Total Assessment is a certain percentage of the fair market value that is determined by local assessors to be the total taxable value of land and additions on the property. | Land | Improvement |
|---|---|---|---|---|
| 2025 | -- | $617,500 | $179,200 | $438,300 |
| 2024 | -- | $600,400 | $173,300 | $427,100 |
| 2023 | -- | $573,300 | $169,900 | $403,400 |
| 2022 | $0 | $590,100 | $166,600 | $423,500 |
| 2021 | $3,634 | $450,000 | $124,900 | $325,100 |
| 2020 | $2,461 | $375,000 | $112,400 | $262,600 |
| 2019 | $2,512 | $375,400 | $112,400 | $263,000 |
| 2018 | $0 | $351,500 | $111,400 | $240,100 |
| 2017 | $2,222 | $327,900 | $111,400 | $216,500 |
| 2016 | $2,188 | $303,400 | $111,400 | $192,000 |
| 2015 | $2,242 | $303,100 | $127,000 | $176,100 |
| 2014 | $2,149 | $286,100 | $121,000 | $165,100 |
Source: Public Records
Map
Nearby Homes
- 9353 S 4460 W
- 4707 W Granada Hills Ct
- 4565 Lennox Dr
- 4904 Wild Acres Dr
- 8941 S Sun Leaf Dr
- 4624 Pine Crossing Dr
- 4424 W Skye Dr
- 9332 S Wild Clover Ln
- 9375 S Laurel Ridge Cir
- 5098 Cherry Laurel Ln
- 9851 S Birdie Way
- 4887 W 8620 S
- 4554 Birdie Way
- 9118 S Wisteria Way
- 3931 W Dansere Cir
- 3750 W Bingham Creek Dr
- 10027 Birdie Way
- 9871 S 4000 W
- 3702 W Angus Dr
- 8577 Autumn Gold Cir
- 4528 Bingham Park Dr
- 4526 Bingham Park Dr
- 4556 Bingham Park Dr
- 4556 W Bingham Park Dr
- 9266 Bingham Hills Ct
- 4514 Bingham Park Dr
- 4551 W Bingham Park Dr
- 4551 Bingham Park Dr
- 9263 S Bingham Hills Ct
- 9263 Bingham Hills Ct
- 9274 Bingham Hills Ct
- 4502 Bingham Park Dr
- 9278 Bingham Park Dr
- 3661 W Old Bingham Hwy Unit 125
- 3685 W Old Bingham Hwy Unit 125
- 9299 Bingham Park Dr
- 9292 Bingham Park Dr
- 9288 Bingham Hills Ct
- 9246 S Wasatch Meadows Dr
- 9246 Wasatch Meadows Dr