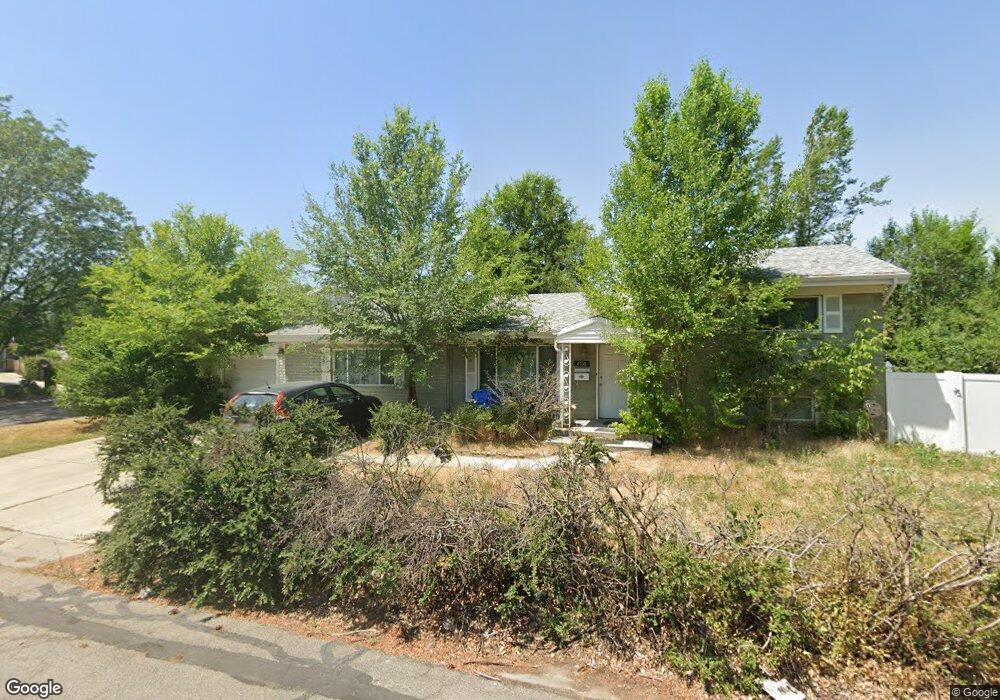
4538 Range Cir Salt Lake City, UT 84117
Estimated Value: $662,000 - $923,000
6
Beds
6
Baths
2,338
Sq Ft
$329/Sq Ft
Est. Value
About This Home
This home is located at 4538 Range Cir, Salt Lake City, UT 84117 and is currently estimated at $768,518, approximately $328 per square foot. 4538 Range Cir is a home located in Salt Lake County with nearby schools including James E Moss Elementary School, Bonneville Junior High School, and Cottonwood High School.
Ownership History
Date
Name
Owned For
Owner Type
Purchase Details
Closed on
Jun 28, 2021
Sold by
Willden Chance
Bought by
Willden Chance and Orellana Cherie
Current Estimated Value
Purchase Details
Closed on
Mar 2, 2020
Sold by
Jackson Jeremiah E
Bought by
Willden Chance
Home Financials for this Owner
Home Financials are based on the most recent Mortgage that was taken out on this home.
Original Mortgage
$371,250
Outstanding Balance
$337,390
Interest Rate
4.99%
Mortgage Type
New Conventional
Estimated Equity
$431,128
Purchase Details
Closed on
Mar 25, 2009
Sold by
Haycock Ildiko
Bought by
Jackson Jeremiah E
Home Financials for this Owner
Home Financials are based on the most recent Mortgage that was taken out on this home.
Original Mortgage
$325,004
Interest Rate
5.15%
Mortgage Type
FHA
Purchase Details
Closed on
Sep 26, 2005
Sold by
Szemerey Gabor and Szemerey Wally
Bought by
Szemerey Gabor and Szemerey Wally
Create a Home Valuation Report for This Property
The Home Valuation Report is an in-depth analysis detailing your home's value as well as a comparison with similar homes in the area
Home Values in the Area
Average Home Value in this Area
Purchase History
| Date | Buyer | Sale Price | Title Company |
|---|---|---|---|
| Willden Chance | -- | Richland Title Ins Agcy Inc | |
| Willden Chance | -- | Integrated Title Ins Svcs | |
| Jackson Jeremiah E | -- | Surety Title | |
| Szemerey Gabor | -- | None Available |
Source: Public Records
Mortgage History
| Date | Status | Borrower | Loan Amount |
|---|---|---|---|
| Open | Willden Chance | $371,250 | |
| Previous Owner | Jackson Jeremiah E | $325,004 |
Source: Public Records
Tax History Compared to Growth
Tax History
| Year | Tax Paid | Tax Assessment Tax Assessment Total Assessment is a certain percentage of the fair market value that is determined by local assessors to be the total taxable value of land and additions on the property. | Land | Improvement |
|---|---|---|---|---|
| 2025 | $4,133 | $754,700 | $270,200 | $484,500 |
| 2024 | $4,133 | $661,800 | $261,900 | $399,900 |
| 2023 | $4,107 | $634,700 | $208,400 | $426,300 |
| 2022 | $3,990 | $546,100 | $204,300 | $341,800 |
| 2021 | $4,028 | $473,500 | $157,200 | $316,300 |
| 2020 | $3,144 | $399,700 | $154,100 | $245,600 |
| 2019 | $2,524 | $313,400 | $147,000 | $166,400 |
| 2018 | $2,606 | $311,600 | $147,000 | $164,600 |
| 2017 | $2,421 | $303,400 | $147,000 | $156,400 |
| 2016 | $2,305 | $271,000 | $147,000 | $124,000 |
| 2015 | $2,417 | $277,800 | $150,000 | $127,800 |
| 2014 | $2,231 | $258,400 | $147,000 | $111,400 |
Source: Public Records
Map
Nearby Homes
- 4538 S Range Cir
- 1096 Quail Park Dr Unit F
- 4611 S Quail Vista Cove Unit C
- 1040 E Quail Park Dr Unit B
- 4443 S 1025 E Unit B2
- 4427 S 1025 E Unit B19
- 4619 S Quail Vista Ln Unit J
- 924 E College St
- 1248 E Freshman Cir
- 918 E Sage Park Ln
- 4468 S Manor Ridge Place Unit 19
- 4412 Garden Dr Unit 27C
- 4570 S Woodduck Ln
- 4554 S Woodduck Ln
- 1345 E Elm Leaf Cove
- 1337 E Lake Springs Ln
- 4738 Woodduck Ln
- 1089 E Sagehill Dr
- 4350 S 900 E
- 4372 S 900 E
- 4535 Countrylane Rd
- 4530 Range Cir
- 1074 E Range Rd
- 1074 E Range Rd
- 1068 Countrylane Rd
- 4537 Range Cir
- 4531 S Countrylane Rd
- 4531 Countrylane Rd
- 1086 Range Rd
- 1096 Range Rd
- 4527 Countrylane Rd
- 1096 E Range Rd
- 4527 S Countrylane Rd
- 4524 Range Cir
- 1060 Countrylane Rd
- 1106 Range Rd
- 4531 Range Cir
- 4531 S Range Cir
- 1113 Range Rd
- 1056 Countrylane Rd