Estimated Value: $334,000 - $361,538
3
Beds
3
Baths
2,440
Sq Ft
$141/Sq Ft
Est. Value
About This Home
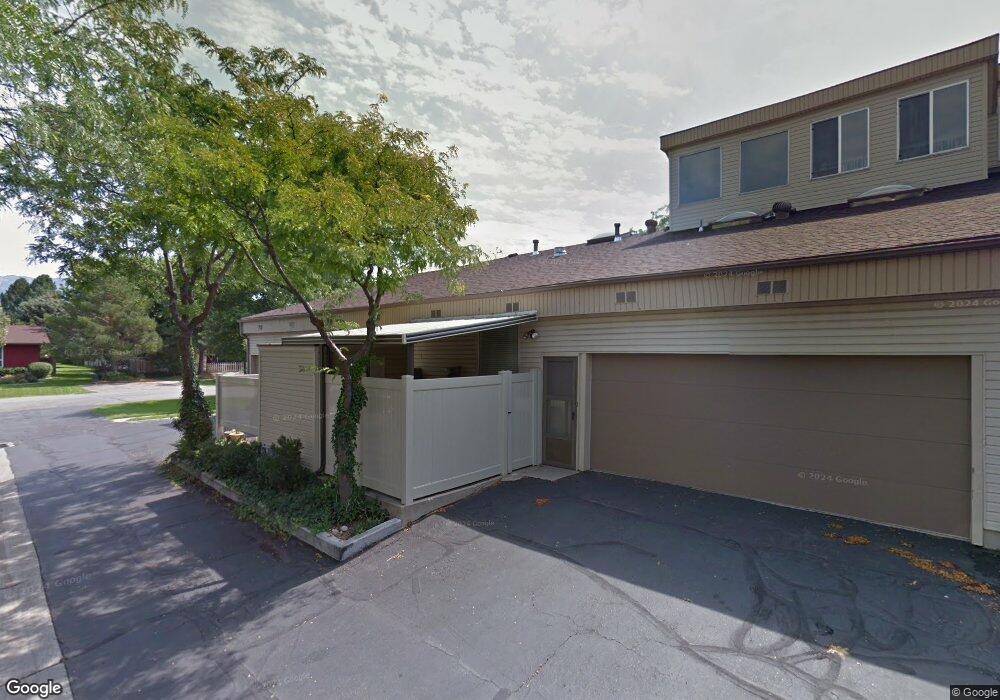
This home is located at 4539 S 1800 W Unit 120, Roy, UT 84067 and is currently estimated at $345,135, approximately $141 per square foot. 4539 S 1800 W Unit 120 is a home located in Weber County with nearby schools including North Park School, Sand Ridge Junior High School, and Roy High School.
Ownership History
Date
Name
Owned For
Owner Type
Purchase Details
Closed on
Apr 21, 2009
Sold by
King Dwight D
Bought by
Ward Clint and Ward Samuel H
Current Estimated Value
Home Financials for this Owner
Home Financials are based on the most recent Mortgage that was taken out on this home.
Original Mortgage
$137,464
Outstanding Balance
$87,132
Interest Rate
4.99%
Mortgage Type
FHA
Estimated Equity
$258,003
Purchase Details
Closed on
Aug 18, 2006
Sold by
Vickroy John W and Vickroy Terri L
Bought by
King Dwight D
Home Financials for this Owner
Home Financials are based on the most recent Mortgage that was taken out on this home.
Original Mortgage
$106,320
Interest Rate
6.76%
Mortgage Type
Purchase Money Mortgage
Purchase Details
Closed on
Mar 6, 2002
Sold by
Vickroy John W
Bought by
Vickroy John W and Vickroy Terri L
Purchase Details
Closed on
Mar 5, 2001
Sold by
Federal National Mortgage Association
Bought by
Vickroy John W
Home Financials for this Owner
Home Financials are based on the most recent Mortgage that was taken out on this home.
Original Mortgage
$82,800
Interest Rate
6.94%
Create a Home Valuation Report for This Property
The Home Valuation Report is an in-depth analysis detailing your home's value as well as a comparison with similar homes in the area
Home Values in the Area
Average Home Value in this Area
Purchase History
| Date | Buyer | Sale Price | Title Company |
|---|---|---|---|
| Ward Clint | -- | Mountain View Title Ogden | |
| King Dwight D | -- | Founders Title Company Syrac | |
| Vickroy John W | -- | Us Title | |
| Vickroy John W | -- | U S Title |
Source: Public Records
Mortgage History
| Date | Status | Borrower | Loan Amount |
|---|---|---|---|
| Open | Ward Clint | $137,464 | |
| Previous Owner | King Dwight D | $106,320 | |
| Previous Owner | Vickroy John W | $82,800 |
Source: Public Records
Tax History Compared to Growth
Tax History
| Year | Tax Paid | Tax Assessment Tax Assessment Total Assessment is a certain percentage of the fair market value that is determined by local assessors to be the total taxable value of land and additions on the property. | Land | Improvement |
|---|---|---|---|---|
| 2025 | $1,948 | $343,680 | $87,000 | $256,680 |
| 2024 | $1,885 | $184,250 | $47,850 | $136,400 |
| 2023 | $1,927 | $188,650 | $47,850 | $140,800 |
| 2022 | $1,831 | $182,600 | $47,850 | $134,750 |
| 2021 | $1,470 | $243,000 | $35,000 | $208,000 |
| 2020 | $1,512 | $229,000 | $35,000 | $194,000 |
| 2019 | $1,273 | $182,000 | $35,000 | $147,000 |
| 2018 | $1,147 | $155,000 | $25,000 | $130,000 |
| 2017 | $1,068 | $136,000 | $25,000 | $111,000 |
| 2016 | $905 | $62,150 | $11,000 | $51,150 |
| 2015 | $800 | $56,650 | $12,650 | $44,000 |
| 2014 | $1,093 | $76,450 | $12,650 | $63,800 |
Source: Public Records
Map
Nearby Homes
- 1825 W 4500 S Unit 101
- 1766 W 4575 S
- 4536 S 1900 W Unit 12
- 4642 S 1900 W Unit 41
- 4602 Hathaway Dr
- 4501 S 1720 W
- 4593 Promenade Dr
- 4502 S 1720 W
- 1825 W 4400 S
- 4552 S 1675 W
- 1681 W 4450 S
- 4475 S 1975 W
- 4438 S 1700 W
- 2038 W 4600 S
- 2082 W 4450 S
- 2067 W 4750 S
- 1789 W 5000 S
- 5006 S 1800 W
- 1765 W 5000 S
- 2015 W 4225 S
- 4539 S 1800 W Unit 110
- 4539 S 1800 W Unit 128
- 4539 S 1800 W Unit 127
- 4539 S 1800 W Unit 126
- 4539 S 1800 W Unit 125
- 4539 S 1800 W Unit 124
- 4539 S 1800 W Unit 123
- 4539 S 1800 W Unit 122
- 4539 S 1800 W Unit 121
- 4539 S 1800 W Unit 119
- 4539 S 1800 W Unit 118
- 4539 S 1800 W Unit 117
- 4539 S 1800 W Unit 116
- 4539 S 1800 W Unit 114
- 4539 S 1800 W Unit 113
- 4539 S 1800 W Unit 112
- 4539 S 1800 W Unit 111
- 4539 S 1800 W Unit 110
- 4539 S 1800 W Unit 109
- 4539 S 1800 W Unit 107