Estimated Value: $457,000 - $472,000
2
Beds
1
Bath
1,331
Sq Ft
$350/Sq Ft
Est. Value
About This Home
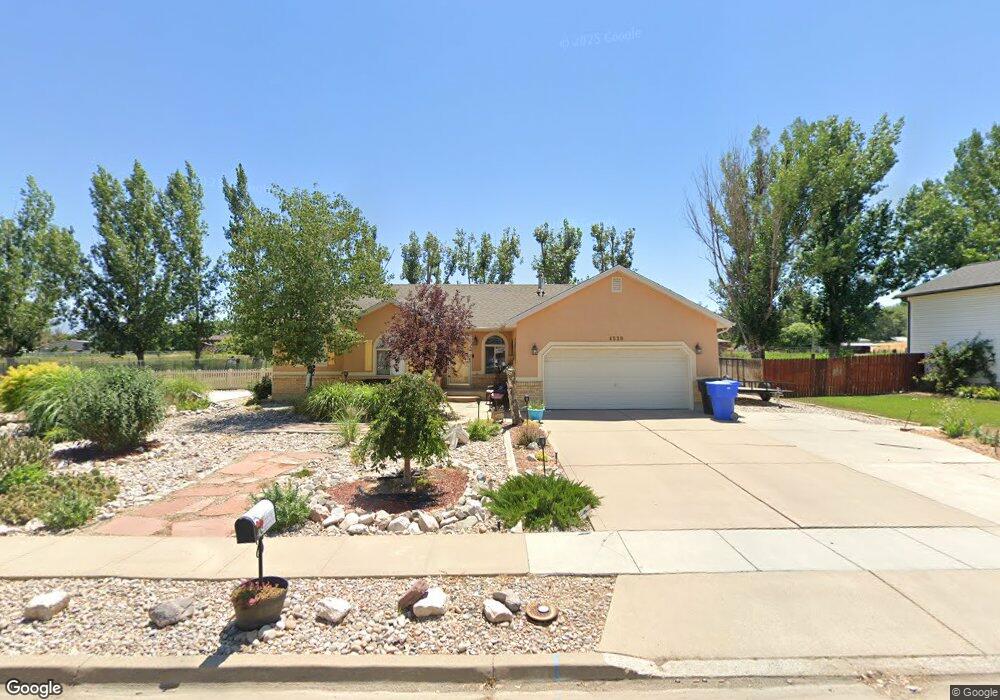
This home is located at 4539 W 1600 N, Ogden, UT 84404 and is currently estimated at $465,794, approximately $349 per square foot. 4539 W 1600 N is a home located in Weber County with nearby schools including Plain City School, Wahlquist Junior High School, and Fremont High School.
Ownership History
Date
Name
Owned For
Owner Type
Purchase Details
Closed on
Aug 29, 2024
Sold by
Cindy Lee Brown Living Trust and Brown Tyson L
Bought by
Barnum Kaden Lane and Barnum Rachel Jade
Current Estimated Value
Home Financials for this Owner
Home Financials are based on the most recent Mortgage that was taken out on this home.
Original Mortgage
$392,755
Interest Rate
6.85%
Mortgage Type
FHA
Create a Home Valuation Report for This Property
The Home Valuation Report is an in-depth analysis detailing your home's value as well as a comparison with similar homes in the area
Home Values in the Area
Average Home Value in this Area
Purchase History
| Date | Buyer | Sale Price | Title Company |
|---|---|---|---|
| Barnum Kaden Lane | -- | Freedom Title | |
| Cindy Lee Brown Living Trust | -- | None Listed On Document |
Source: Public Records
Mortgage History
| Date | Status | Borrower | Loan Amount |
|---|---|---|---|
| Open | Barnum Kaden Lane | $20,000 | |
| Previous Owner | Barnum Kaden Lane | $392,755 |
Source: Public Records
Tax History Compared to Growth
Tax History
| Year | Tax Paid | Tax Assessment Tax Assessment Total Assessment is a certain percentage of the fair market value that is determined by local assessors to be the total taxable value of land and additions on the property. | Land | Improvement |
|---|---|---|---|---|
| 2025 | $2,385 | $417,800 | $180,002 | $237,798 |
| 2024 | $2,292 | $226,599 | $99,001 | $127,598 |
| 2023 | $2,298 | $228,800 | $98,992 | $129,808 |
| 2022 | $2,218 | $226,051 | $93,506 | $132,545 |
| 2021 | $1,898 | $321,000 | $80,008 | $240,992 |
| 2020 | $1,820 | $283,000 | $65,047 | $217,953 |
| 2019 | $1,769 | $259,000 | $54,641 | $204,359 |
| 2018 | $1,636 | $226,000 | $54,641 | $171,359 |
| 2017 | $1,498 | $194,000 | $54,641 | $139,359 |
| 2016 | $1,401 | $98,433 | $30,053 | $68,380 |
| 2015 | $1,447 | $100,436 | $30,053 | $70,383 |
| 2014 | $1,211 | $79,162 | $17,959 | $61,203 |
Source: Public Records
Map
Nearby Homes
- 4494 W 1600 N
- 4370 W 1500 N
- 4227 W Pioneer Rd
- 1885 N 4475 W
- 1748 N 4100 St W
- 4210 W 1975 N
- 2131 N 4650 W
- 1239 N 4925 W
- 1221 N 4975 W
- 3966 W 2200 N
- 2416 N 4275 W
- 3622 W 2200 St N Unit 23
- 4212 W 1975 N
- 3594 W 2200 N Unit 3
- 2700 N 4200 W
- 2255 N 3600 St W Unit 21
- 2233 N 3600 St W Unit 22
- 2793 W 2775 N
- 2797 W 2775 N Unit 129
- 2782 W 2775 N Unit 105
- 4527 W 1600 N
- 4553 W 1600 N
- 4536 W 1600 N
- 4548 W 1600 N
- 4522 W 1600 N
- 4515 W 1600 N
- 4571 W 1600 N
- 4564 W 1600 N
- 4510 W 1600 N
- 4537 W 1650 N
- 4545 W 1650 N
- 4521 W 1650 N
- 4497 W 1600 N
- 4497 W 1600 N Unit 24
- 4585 W 1600 N
- 4561 W 1650 N
- 4527 W 1650 N
- 4494 W 1600 N Unit 25
- 4498 W 1550 N
- 4498 W 1550 N Unit 13