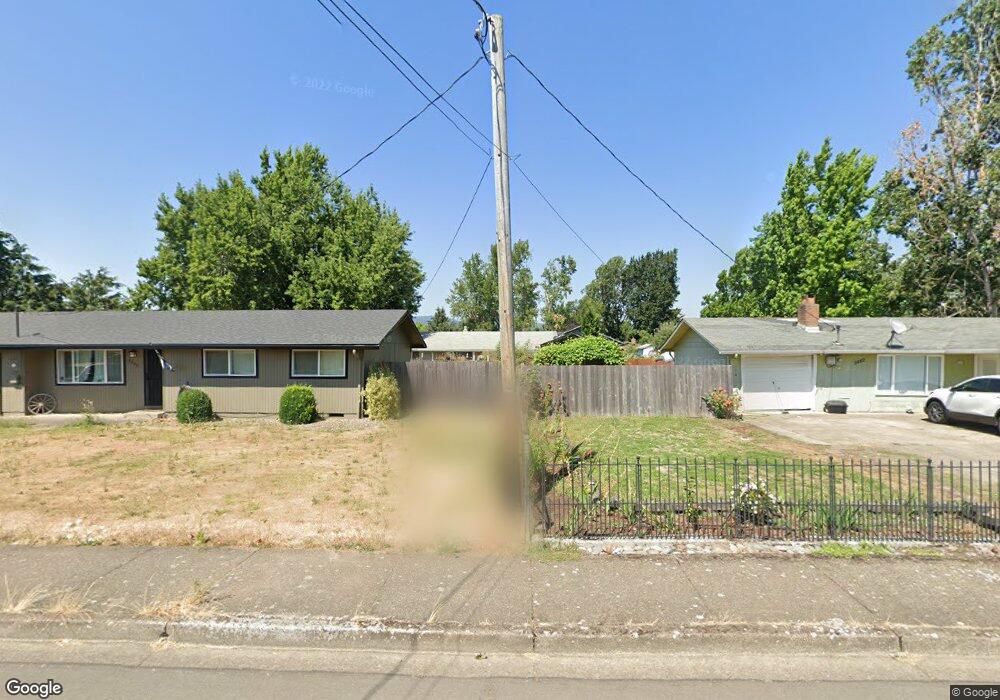
454 35th St Springfield, OR 97478
East Springfield NeighborhoodEstimated Value: $330,000 - $411,098
3
Beds
2
Baths
1,390
Sq Ft
$261/Sq Ft
Est. Value
About This Home
This home is located at 454 35th St, Springfield, OR 97478 and is currently estimated at $362,775, approximately $260 per square foot. 454 35th St is a home located in Lane County with nearby schools including Riverbend Elementary School, Briggs Middle School, and Thurston High School.
Ownership History
Date
Name
Owned For
Owner Type
Purchase Details
Closed on
Jan 26, 2016
Sold by
Clifton Todd R and Gross Tina J
Bought by
Demaray Matthew Ray and Demaray Melissa Dawn
Current Estimated Value
Home Financials for this Owner
Home Financials are based on the most recent Mortgage that was taken out on this home.
Original Mortgage
$164,957
Outstanding Balance
$128,819
Interest Rate
3.5%
Mortgage Type
FHA
Estimated Equity
$233,956
Purchase Details
Closed on
May 21, 1998
Sold by
Baker Robert W and Baker Shirley M
Bought by
Clifton Todd R and Clifton Tina J
Home Financials for this Owner
Home Financials are based on the most recent Mortgage that was taken out on this home.
Original Mortgage
$114,162
Interest Rate
7.07%
Mortgage Type
FHA
Create a Home Valuation Report for This Property
The Home Valuation Report is an in-depth analysis detailing your home's value as well as a comparison with similar homes in the area
Home Values in the Area
Average Home Value in this Area
Purchase History
| Date | Buyer | Sale Price | Title Company |
|---|---|---|---|
| Demaray Matthew Ray | $168,000 | Fidelity Natl Title Co Of Or | |
| Clifton Todd R | $115,000 | Evergreen Land Title Co |
Source: Public Records
Mortgage History
| Date | Status | Borrower | Loan Amount |
|---|---|---|---|
| Open | Demaray Matthew Ray | $164,957 | |
| Previous Owner | Clifton Todd R | $114,162 |
Source: Public Records
Tax History
| Year | Tax Paid | Tax Assessment Tax Assessment Total Assessment is a certain percentage of the fair market value that is determined by local assessors to be the total taxable value of land and additions on the property. | Land | Improvement |
|---|---|---|---|---|
| 2025 | $4,489 | $244,790 | -- | -- |
| 2024 | $4,416 | $237,661 | -- | -- |
| 2023 | $4,416 | $230,739 | $0 | $0 |
| 2022 | $4,090 | $224,019 | $0 | $0 |
| 2021 | $4,017 | $217,495 | $0 | $0 |
| 2020 | $3,899 | $211,161 | $0 | $0 |
| 2019 | $3,782 | $205,011 | $0 | $0 |
| 2018 | $3,565 | $193,243 | $0 | $0 |
| 2017 | $3,428 | $193,243 | $0 | $0 |
| 2016 | $3,356 | $187,615 | $0 | $0 |
| 2015 | $3,261 | $182,150 | $0 | $0 |
| 2014 | $3,211 | $176,845 | $0 | $0 |
Source: Public Records
Map
Nearby Homes
Your Personal Tour Guide
Ask me questions while you tour the home.