Estimated Value: $157,000 - $240,000
3
Beds
2
Baths
1,082
Sq Ft
$190/Sq Ft
Est. Value
About This Home
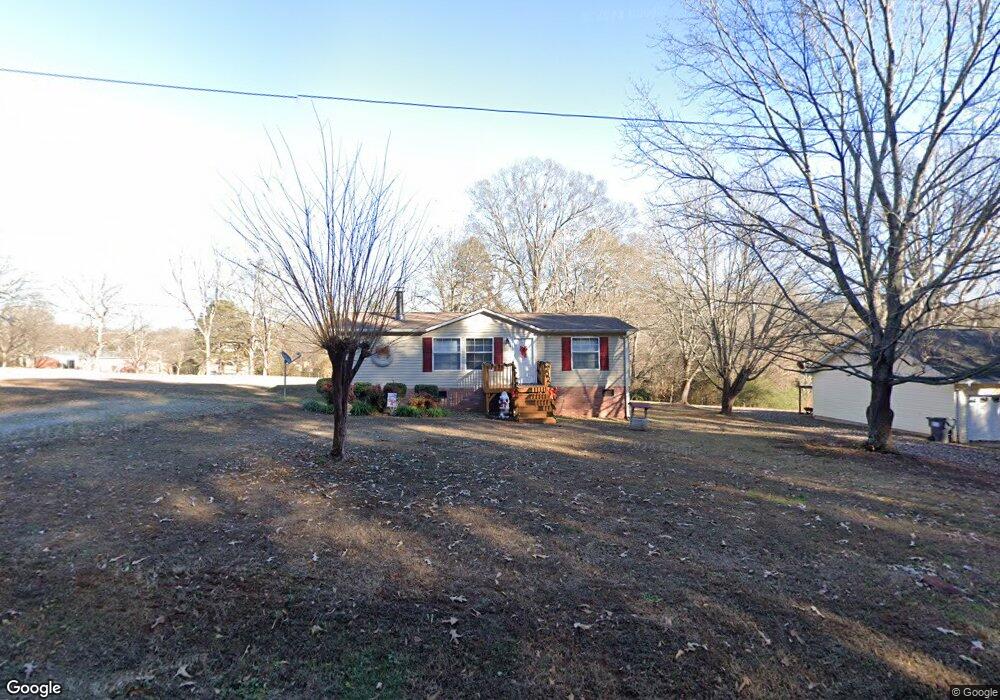
This home is located at 454 Cothran Creek Rd, Inman, SC 29349 and is currently estimated at $205,290, approximately $189 per square foot. 454 Cothran Creek Rd is a home located in Spartanburg County with nearby schools including Inman Elementary School, T.E. Mabry Middle School, and Chapman High School.
Ownership History
Date
Name
Owned For
Owner Type
Purchase Details
Closed on
Jul 28, 2017
Sold by
Smith Casey W
Bought by
Brown Derek R
Current Estimated Value
Home Financials for this Owner
Home Financials are based on the most recent Mortgage that was taken out on this home.
Original Mortgage
$124,242
Outstanding Balance
$103,281
Interest Rate
3.91%
Mortgage Type
New Conventional
Estimated Equity
$102,009
Purchase Details
Closed on
Jun 23, 2015
Sold by
Camp Thomas J
Bought by
Smith Casey W
Purchase Details
Closed on
May 12, 2015
Sold by
Camp Ruth Betty
Bought by
Camp Thomas J
Purchase Details
Closed on
Jun 1, 2010
Sold by
Drake Dustin W
Bought by
Camp Thomas J and Camp Ruth Betty
Home Financials for this Owner
Home Financials are based on the most recent Mortgage that was taken out on this home.
Original Mortgage
$97,137
Interest Rate
4.91%
Mortgage Type
FHA
Purchase Details
Closed on
Mar 14, 2008
Sold by
Mcgraw David Roy
Bought by
Drake Dustin W
Create a Home Valuation Report for This Property
The Home Valuation Report is an in-depth analysis detailing your home's value as well as a comparison with similar homes in the area
Home Values in the Area
Average Home Value in this Area
Purchase History
| Date | Buyer | Sale Price | Title Company |
|---|---|---|---|
| Brown Derek R | $123,000 | None Available | |
| Smith Casey W | $109,500 | Attorney | |
| Camp Thomas J | -- | -- | |
| Camp Thomas J | $101,000 | -- | |
| Drake Dustin W | $15,000 | Attorney |
Source: Public Records
Mortgage History
| Date | Status | Borrower | Loan Amount |
|---|---|---|---|
| Open | Brown Derek R | $124,242 | |
| Previous Owner | Camp Thomas J | $97,137 |
Source: Public Records
Tax History
| Year | Tax Paid | Tax Assessment Tax Assessment Total Assessment is a certain percentage of the fair market value that is determined by local assessors to be the total taxable value of land and additions on the property. | Land | Improvement |
|---|---|---|---|---|
| 2022 | $1,244 | $4,920 | $576 | $4,344 |
| 2021 | $1,219 | $4,920 | $576 | $4,344 |
| 2020 | $1,190 | $4,920 | $576 | $4,344 |
| 2019 | $1,205 | $4,920 | $576 | $4,344 |
| 2018 | $1,236 | $4,920 | $576 | $4,344 |
| 2017 | $1,087 | $4,380 | $576 | $3,804 |
| 2016 | $3,073 | $6,570 | $864 | $5,706 |
| 2015 | $917 | $3,828 | $576 | $3,252 |
| 2014 | -- | $3,828 | $576 | $3,252 |
Source: Public Records
Map
Nearby Homes
- 17 1st St
- 342 Carramore Dr
- 221 N Main St
- 155 Wingo St
- 26 Blackstock Rd
- 304 Bellrock Rd
- 322 Bellrock Rd
- 310 Bellrock Rd
- 321 Bellrock Rd
- 314 Bellrock Rd
- 325 Bellrock Rd
- 329 Bellrock Rd
- 0 Church Ave
- 317 Bellrock Rd
- 318 Bellrock Rd
- 11031 Asheville Hwy
- 119 Beechwood Dr
- 5 S Howard St
- 240 Inman Mills Rd
- 7 Lawrence St
- 450 Cothran Creek Rd
- 444 Cothran Creek Rd
- 490 Cothran Creek Rd
- 440 Cothran Creek Rd
- 495 Cothran Creek Rd
- 520 Cothran Creek Rd
- 12641 Asheville Hwy
- 531 Cothran Creek Rd
- 240 Park Rd
- 551 Cothran Creek Rd
- 3 A St
- 550 Cothran Creek Rd
- 2 1st St
- 3 A St
- 12721 Asheville Hwy
- 12700 Asheville Hwy
- 0 Park Rd
- 4 1st St
- 571 Cothran Creek Rd
- 7 A St
Your Personal Tour Guide
Ask me questions while you tour the home.