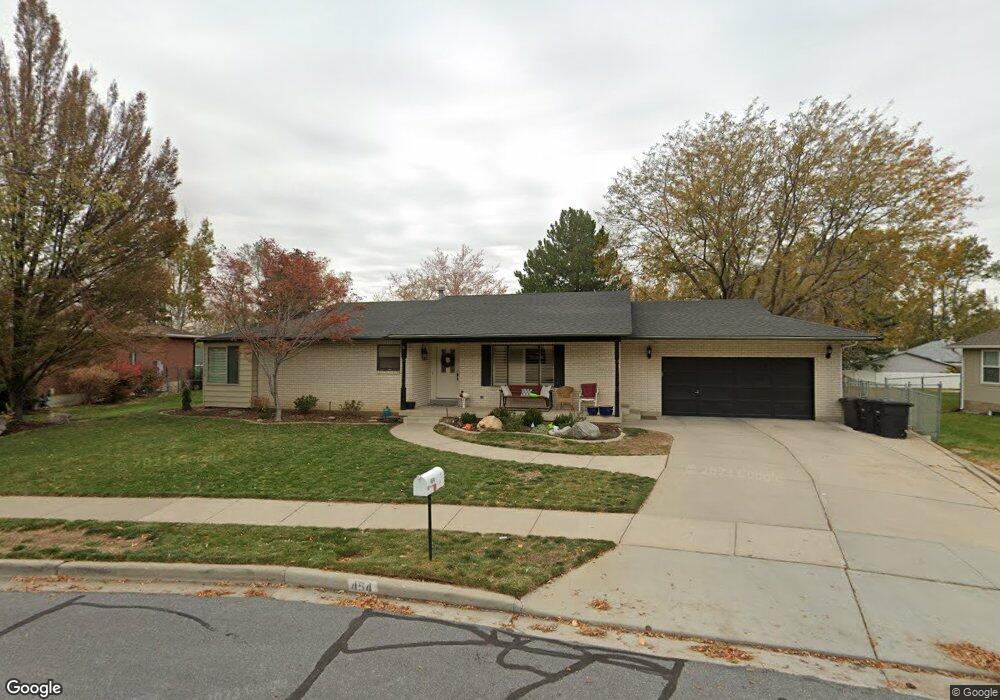
454 E 850 S Centerville, UT 84014
Estimated Value: $638,000 - $688,000
4
Beds
3
Baths
1,563
Sq Ft
$418/Sq Ft
Est. Value
About This Home
This home is located at 454 E 850 S, Centerville, UT 84014 and is currently estimated at $652,848, approximately $417 per square foot. 454 E 850 S is a home located in Davis County with nearby schools including J A Taylor Elementary School, Centerville Jr High, and Viewmont High School.
Ownership History
Date
Name
Owned For
Owner Type
Purchase Details
Closed on
May 31, 2022
Sold by
Glen C Brewer Living Trust
Bought by
Larsen Lars B and Larsen Anne C
Current Estimated Value
Home Financials for this Owner
Home Financials are based on the most recent Mortgage that was taken out on this home.
Original Mortgage
$377,500
Outstanding Balance
$358,131
Interest Rate
5.1%
Mortgage Type
New Conventional
Estimated Equity
$294,717
Purchase Details
Closed on
Aug 5, 2008
Sold by
Brewer Glen C
Bought by
Brewer Glen C
Home Financials for this Owner
Home Financials are based on the most recent Mortgage that was taken out on this home.
Original Mortgage
$50,000
Interest Rate
6.42%
Mortgage Type
Credit Line Revolving
Create a Home Valuation Report for This Property
The Home Valuation Report is an in-depth analysis detailing your home's value as well as a comparison with similar homes in the area
Purchase History
| Date | Buyer | Sale Price | Title Company |
|---|---|---|---|
| Larsen Lars B | -- | None Listed On Document | |
| Brewer Glen C | -- | First American Title Ncs | |
| Brewer Glen C | -- | First American Title Ncs |
Source: Public Records
Mortgage History
| Date | Status | Borrower | Loan Amount |
|---|---|---|---|
| Open | Larsen Lars B | $377,500 | |
| Previous Owner | Brewer Glen C | $50,000 |
Source: Public Records
Tax History
| Year | Tax Paid | Tax Assessment Tax Assessment Total Assessment is a certain percentage of the fair market value that is determined by local assessors to be the total taxable value of land and additions on the property. | Land | Improvement |
|---|---|---|---|---|
| 2025 | $3,766 | $324,500 | $172,523 | $151,977 |
| 2024 | $3,222 | $313,500 | $157,331 | $156,169 |
| 2023 | $3,123 | $549,000 | $255,099 | $293,901 |
| 2022 | $3,256 | $315,150 | $129,415 | $185,735 |
| 2021 | $2,858 | $431,000 | $200,881 | $230,119 |
| 2020 | $2,607 | $393,000 | $194,522 | $198,478 |
| 2019 | $2,601 | $383,000 | $189,422 | $193,578 |
| 2018 | $2,406 | $350,000 | $175,465 | $174,535 |
| 2016 | $239 | $169,180 | $62,037 | $107,143 |
| 2015 | $2,055 | $156,750 | $62,037 | $94,713 |
| 2014 | $103 | $154,107 | $61,941 | $92,166 |
| 2013 | -- | $153,123 | $49,950 | $103,173 |
Source: Public Records
Map
Nearby Homes
- 345 E 600 S
- 495 E 475 S
- 610 E Pages Ln
- 610 S 800 E
- 967 S Courtyard Ln
- 328 E 1100 S
- 360 E Center St
- 96 Village Square Rd
- 1420 N Main St
- 951 Centerville Commons Way
- 662 E 1200 N
- 88 W 50 S Unit C-3
- 88 W 50 S Unit B5
- 252 N 400 E
- 330 W Paradiso Ln
- 204 Lyman Ln
- 380 E 400 N
- 56 W 200 N
- 975 E 1050 N
- 1260 N 200 W
Your Personal Tour Guide
Ask me questions while you tour the home.