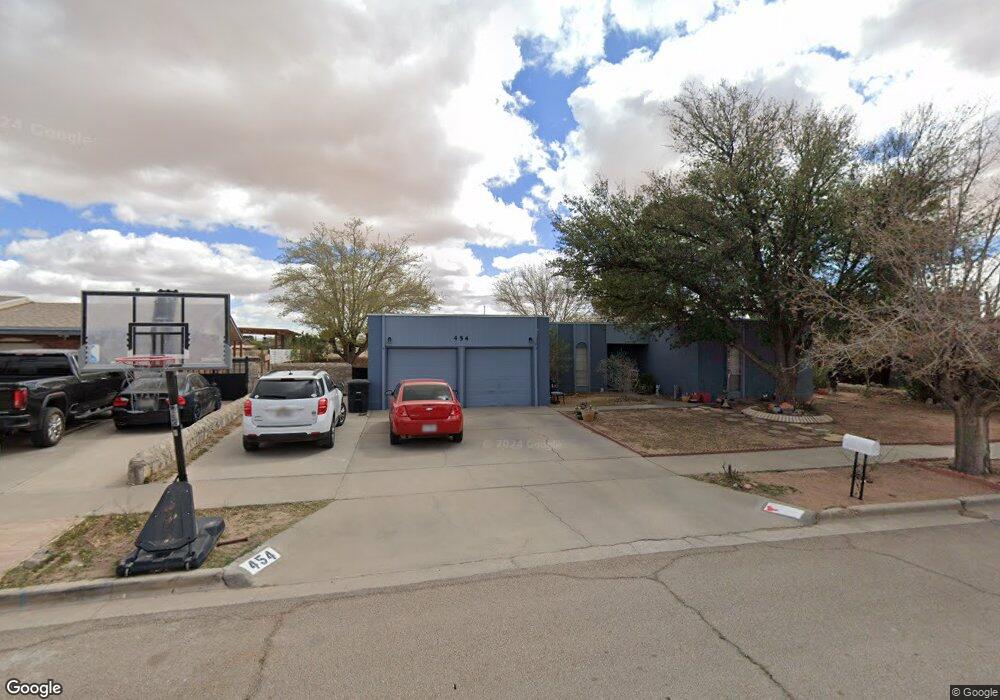
454 Loring Place Horizon City, TX 79928
Estimated Value: $248,739 - $264,000
3
Beds
2
Baths
1,782
Sq Ft
$143/Sq Ft
Est. Value
About This Home
This home is located at 454 Loring Place, Horizon City, TX 79928 and is currently estimated at $254,685, approximately $142 per square foot. 454 Loring Place is a home located in El Paso County with nearby schools including Horizon Heights Elementary School, Col. John O. Ensor Middle School, and Eastlake High School.
Ownership History
Date
Name
Owned For
Owner Type
Purchase Details
Closed on
Aug 24, 2000
Sold by
Associates Relocation Management Co Inc
Bought by
Townsend Carl A and Townsend Dorothy S
Current Estimated Value
Home Financials for this Owner
Home Financials are based on the most recent Mortgage that was taken out on this home.
Original Mortgage
$64,800
Outstanding Balance
$23,479
Interest Rate
8.21%
Estimated Equity
$231,206
Purchase Details
Closed on
Oct 29, 1997
Sold by
Prudential Residential Svcs Ltd Prtnrshp
Bought by
Green Bryan R and Green Deborah S
Home Financials for this Owner
Home Financials are based on the most recent Mortgage that was taken out on this home.
Original Mortgage
$69,785
Interest Rate
7.23%
Mortgage Type
FHA
Purchase Details
Closed on
May 11, 1994
Sold by
Flores Carlos and Flores Loretta S
Bought by
Harris James E and Harris Debra A
Home Financials for this Owner
Home Financials are based on the most recent Mortgage that was taken out on this home.
Original Mortgage
$66,462
Interest Rate
8.03%
Mortgage Type
FHA
Create a Home Valuation Report for This Property
The Home Valuation Report is an in-depth analysis detailing your home's value as well as a comparison with similar homes in the area
Home Values in the Area
Average Home Value in this Area
Purchase History
| Date | Buyer | Sale Price | Title Company |
|---|---|---|---|
| Townsend Carl A | -- | -- | |
| Green Bryan R | -- | -- | |
| Harris James E | -- | -- |
Source: Public Records
Mortgage History
| Date | Status | Borrower | Loan Amount |
|---|---|---|---|
| Open | Townsend Carl A | $64,800 | |
| Previous Owner | Green Bryan R | $69,785 | |
| Previous Owner | Harris James E | $66,462 |
Source: Public Records
Tax History Compared to Growth
Tax History
| Year | Tax Paid | Tax Assessment Tax Assessment Total Assessment is a certain percentage of the fair market value that is determined by local assessors to be the total taxable value of land and additions on the property. | Land | Improvement |
|---|---|---|---|---|
| 2025 | $6,867 | $219,055 | $17,205 | $201,850 |
| 2024 | $6,867 | $219,055 | $17,205 | $201,850 |
| 2023 | $6,867 | $208,964 | $17,205 | $191,759 |
| 2022 | $6,257 | $197,446 | $17,205 | $180,241 |
| 2021 | $5,421 | $154,143 | $17,205 | $136,938 |
| 2020 | $4,533 | $128,133 | $17,205 | $110,928 |
| 2018 | $3,721 | $115,403 | $17,205 | $98,198 |
| 2017 | $3,472 | $108,881 | $17,205 | $91,676 |
| 2016 | $3,909 | $122,580 | $17,205 | $105,375 |
| 2015 | $3,864 | $122,580 | $17,205 | $105,375 |
| 2014 | $3,864 | $124,674 | $17,205 | $107,469 |
Source: Public Records
Map
Nearby Homes
- 14841 Kingston Rd
- 13957 Paseo Honor Ct
- 14829 Kingston Rd
- 14937 Roslyn Dr
- 485 Jeweled Mesa Ct
- 14800 Kingston Dr Rd
- 3705 Roslyn Dr
- TBD Tbd
- 781 Cedarwood Dr
- 769 Cedarwood Dr
- 785 Cedarwood Dr
- 13845 Paseo Alegre Ave
- 521 Paseo Modesto Dr
- Plan 1741 at Paseo Del Este - Paseo Del Este 5
- Sofia Plan at Paseo Del Este - Paseo del Este (HOA Community)
- Plan 1667 at Paseo Del Este - Paseo Del Este 5
- Marcos Plan at Paseo Del Este - Paseo del Este (HOA Community)
- Jade Plan at Paseo Del Este - Paseo del Este (HOA Community)
- Pearl Plan at Paseo Del Este - Paseo del Este (HOA Community)
- Brooks Plan at Paseo Del Este - Paseo del Este (HOA Community)
- 458 Loring Place
- 450 Loring Place
- 14905 Roslyn Dr
- 462 Loring Place
- 453 Loring Place
- 14899 Roslyn Dr
- 14899 Roslyn Dr Unit 1
- 457 Loring Place
- 14909 Roslyn Dr
- 445 Penroy Ln
- 461 Loring Place
- 466 Loring Place
- 14908 Roslyn Dr
- 14917 Roslyn Dr
- 14849 Holden Cir
- 14853 Holden Cir
- 14845 Holden Cir
- 441 Penroy Ln
- 14857 Holden Cir
- 14912 Roslyn Dr