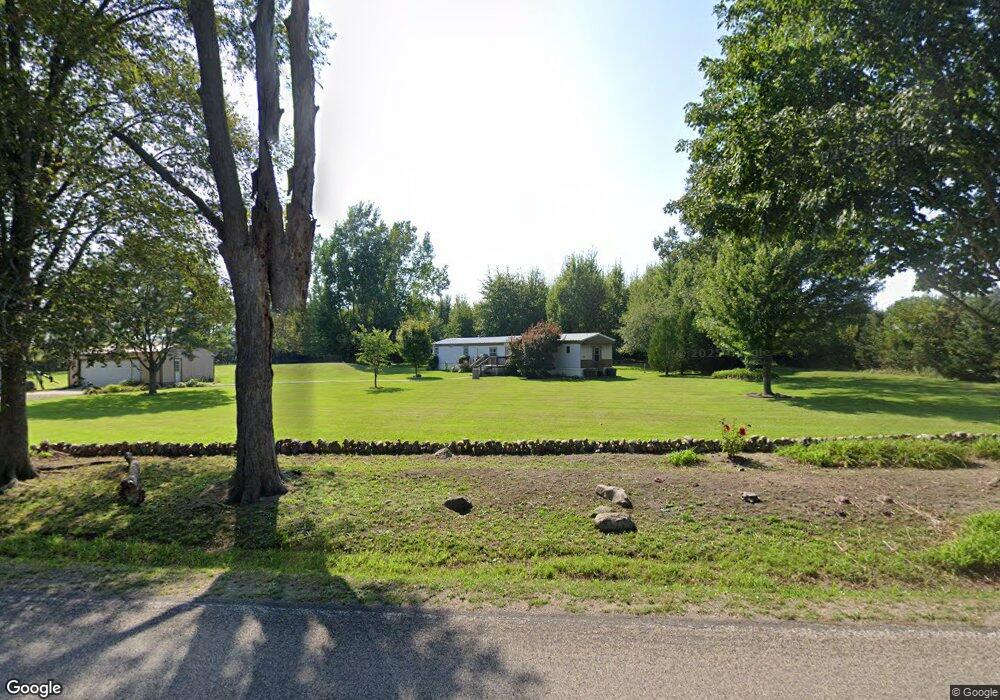
454 N Fremont Rd Quincy, MI 49082
Estimated Value: $133,337 - $241,000
3
Beds
2
Baths
1,120
Sq Ft
$151/Sq Ft
Est. Value
About This Home
This home is located at 454 N Fremont Rd, Quincy, MI 49082 and is currently estimated at $168,584, approximately $150 per square foot. 454 N Fremont Rd is a home located in Branch County with nearby schools including Jennings Elementary School, Quincy Middle School, and Quincy High School.
Ownership History
Date
Name
Owned For
Owner Type
Purchase Details
Closed on
Oct 28, 2009
Sold by
Dedmon Ashley Glyn and Dedmon Christina F
Bought by
Dedmon Ashley Glyn and Dedmon Christina F
Current Estimated Value
Home Financials for this Owner
Home Financials are based on the most recent Mortgage that was taken out on this home.
Original Mortgage
$45,654
Outstanding Balance
$29,917
Interest Rate
5.07%
Mortgage Type
New Conventional
Estimated Equity
$138,667
Purchase Details
Closed on
Jun 2, 2004
Sold by
France Christina F
Bought by
Dedmon Ashley Glyn and France Christina F
Home Financials for this Owner
Home Financials are based on the most recent Mortgage that was taken out on this home.
Original Mortgage
$51,700
Interest Rate
6.37%
Mortgage Type
Purchase Money Mortgage
Purchase Details
Closed on
Mar 10, 1996
Sold by
Miller Nancy A and Miller Brent J
Bought by
Butler Dorothy and Butler Richard
Create a Home Valuation Report for This Property
The Home Valuation Report is an in-depth analysis detailing your home's value as well as a comparison with similar homes in the area
Home Values in the Area
Average Home Value in this Area
Purchase History
| Date | Buyer | Sale Price | Title Company |
|---|---|---|---|
| Dedmon Ashley Glyn | -- | Lighthouse Title Inc | |
| Dedmon Ashley Glyn | -- | -- | |
| France Christina F | $60,000 | Chicago Title | |
| Butler Dorothy | $26,000 | -- |
Source: Public Records
Mortgage History
| Date | Status | Borrower | Loan Amount |
|---|---|---|---|
| Open | Dedmon Ashley Glyn | $45,654 | |
| Closed | France Christina F | $51,700 |
Source: Public Records
Tax History Compared to Growth
Tax History
| Year | Tax Paid | Tax Assessment Tax Assessment Total Assessment is a certain percentage of the fair market value that is determined by local assessors to be the total taxable value of land and additions on the property. | Land | Improvement |
|---|---|---|---|---|
| 2025 | $798 | $38,610 | $0 | $0 |
| 2024 | $282 | $38,634 | $0 | $0 |
| 2023 | $256 | $34,740 | $0 | $0 |
| 2022 | $256 | $29,044 | $0 | $0 |
| 2021 | -- | $27,268 | $0 | $0 |
| 2020 | -- | $28,509 | $0 | $0 |
| 2019 | -- | $27,659 | $0 | $0 |
| 2018 | -- | $27,752 | $0 | $0 |
| 2017 | -- | $25,625 | $0 | $0 |
| 2016 | -- | $21,020 | $0 | $0 |
| 2015 | -- | $23,702 | $0 | $0 |
| 2014 | -- | $22,538 | $0 | $0 |
| 2013 | -- | $21,245 | $0 | $0 |
Source: Public Records
Map
Nearby Homes
- 732 Cambridge Dr
- 410 N Fiske Rd
- VL N Fiske Rd
- 0 Lott Rd
- N/A North Dr
- 0 N Willowbrook Rd Unit 24042121
- N/A N Willowbrook Rd
- 78 Taylor St
- 46 W Chicago St
- 44 Berry St
- 42 W Chicago St
- 21 Cole St
- 34 Park St
- 14 Cole St
- 912 Beckwith Shore
- 9 Cole St
- 34 W Liberty St
- 69 N Main St
- 586 Schaeffer Dr
- 1014 Aguadero Pkwy