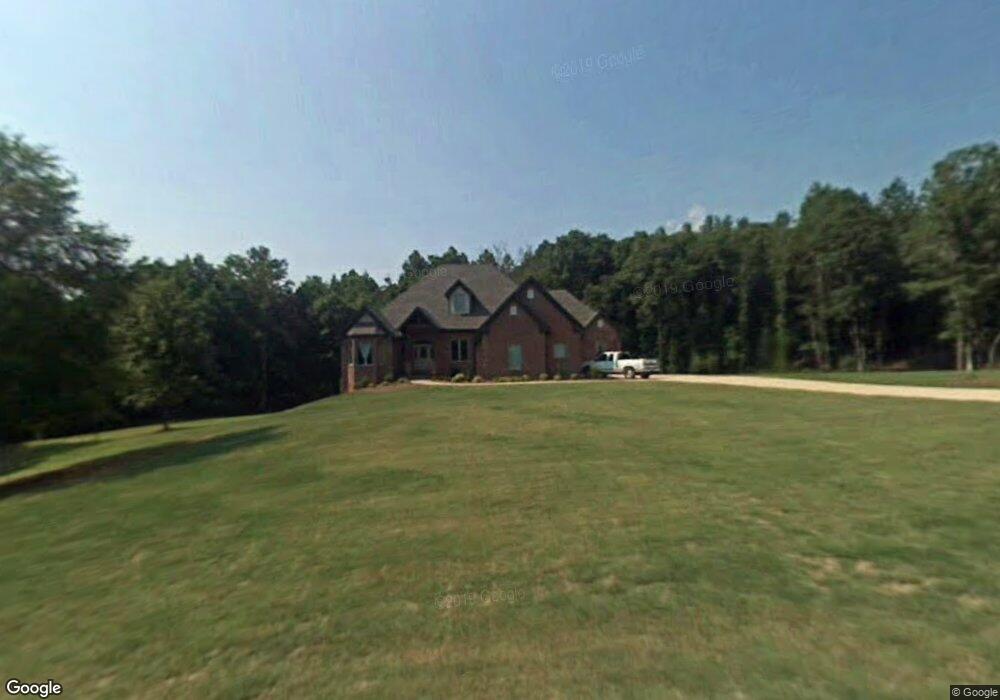
454 Primrose Ln Unit 11 Pendergrass, GA 30567
Estimated Value: $607,722 - $634,000
--
Bed
4
Baths
2,680
Sq Ft
$230/Sq Ft
Est. Value
About This Home
This home is located at 454 Primrose Ln Unit 11, Pendergrass, GA 30567 and is currently estimated at $617,181, approximately $230 per square foot. 454 Primrose Ln Unit 11 is a home located in Jackson County with nearby schools including North Jackson Elementary School, West Jackson Middle School, and Jackson County High School.
Ownership History
Date
Name
Owned For
Owner Type
Purchase Details
Closed on
Mar 22, 2022
Sold by
Hollings Earle R
Bought by
Hensley Patrick Thomas
Current Estimated Value
Home Financials for this Owner
Home Financials are based on the most recent Mortgage that was taken out on this home.
Original Mortgage
$474,050
Outstanding Balance
$441,752
Interest Rate
3.69%
Mortgage Type
New Conventional
Estimated Equity
$175,429
Purchase Details
Closed on
Mar 7, 2019
Sold by
Vandiver Eugene
Bought by
Hollings Earle R and Hollings Nicole
Home Financials for this Owner
Home Financials are based on the most recent Mortgage that was taken out on this home.
Original Mortgage
$319,495
Interest Rate
4.25%
Mortgage Type
FHA
Purchase Details
Closed on
Aug 31, 2004
Sold by
Land Specialty
Bought by
Vandiver Eugene A
Create a Home Valuation Report for This Property
The Home Valuation Report is an in-depth analysis detailing your home's value as well as a comparison with similar homes in the area
Home Values in the Area
Average Home Value in this Area
Purchase History
| Date | Buyer | Sale Price | Title Company |
|---|---|---|---|
| Hensley Patrick Thomas | $499,000 | -- | |
| Hollings Earle R | $350,000 | -- | |
| Vandiver Eugene A | $50,000 | -- |
Source: Public Records
Mortgage History
| Date | Status | Borrower | Loan Amount |
|---|---|---|---|
| Open | Hensley Patrick Thomas | $474,050 | |
| Previous Owner | Hollings Earle R | $319,495 |
Source: Public Records
Tax History Compared to Growth
Tax History
| Year | Tax Paid | Tax Assessment Tax Assessment Total Assessment is a certain percentage of the fair market value that is determined by local assessors to be the total taxable value of land and additions on the property. | Land | Improvement |
|---|---|---|---|---|
| 2024 | $4,382 | $178,840 | $16,000 | $162,840 |
| 2023 | $4,429 | $161,520 | $16,000 | $145,520 |
| 2022 | $3,518 | $124,200 | $6,400 | $117,800 |
| 2021 | $3,543 | $124,200 | $6,400 | $117,800 |
| 2020 | $3,258 | $104,120 | $6,400 | $97,720 |
| 2019 | $2,244 | $104,120 | $6,400 | $97,720 |
| 2018 | $2,127 | $99,400 | $6,400 | $93,000 |
| 2017 | $1,942 | $92,632 | $6,400 | $86,232 |
| 2016 | $1,957 | $92,632 | $6,400 | $86,232 |
| 2015 | $2,132 | $97,690 | $8,000 | $89,690 |
| 2014 | $1,773 | $86,528 | $8,000 | $78,528 |
| 2013 | -- | $86,528 | $8,000 | $78,528 |
Source: Public Records
Map
Nearby Homes
- 327 Primrose Ln
- 599 Primrose Ln
- 91 Lenten Rose Ln
- 43 Water Lily Way
- 67 Forest Lake Cir
- 290 Emily Forest Way
- 412 Emily Forest Way
- 0 Wayne Poultry Rd Unit 10529366
- 4394 Holly Springs Rd
- 309 Mulberry Creek Ct
- 1017 Sope Creek Cir
- 1206 Ridgewood Dr
- 0 Marlow Rd Unit 10587501
- 0 Marlow Rd Unit 7635185
- Plan 2328 at The Fields of Walnut Creek
- Plan 3629 at The Fields of Walnut Creek
- Plan 2421 at The Fields of Walnut Creek
- Plan 2030 at The Fields of Walnut Creek
- Plan 2628 at The Fields of Walnut Creek
- Plan 2620 at The Fields of Walnut Creek
- 420 Primrose Ln
- 469 Primrose Ln Unit 3B
- 385 Primrose Ln
- 592 Primrose Ln
- 528 Primrose Ln Unit 12
- 528 Primrose Ln
- 525 Primrose Ln
- Lot3 A Primrose Ln
- Lot 3A Primrose Ln
- 10 Primrose Ln
- LOT3-A Primrose Ln
- 654 Primrose Ln
- 9 Primrose Ln
- 259 Primrose Ln
- 88 Trilium Trail
- 117 Lenten Rose Ln
- 117 Lenten Rose Ln Unit 7
- 0 Spirit Lake Dr Unit LOT 6 3084696
- 0000 Spirit Lake Dr
- 0 Spirit Lake Dr Unit 7528840