Estimated Value: $204,000 - $221,000
3
Beds
2
Baths
1,080
Sq Ft
$195/Sq Ft
Est. Value
About This Home
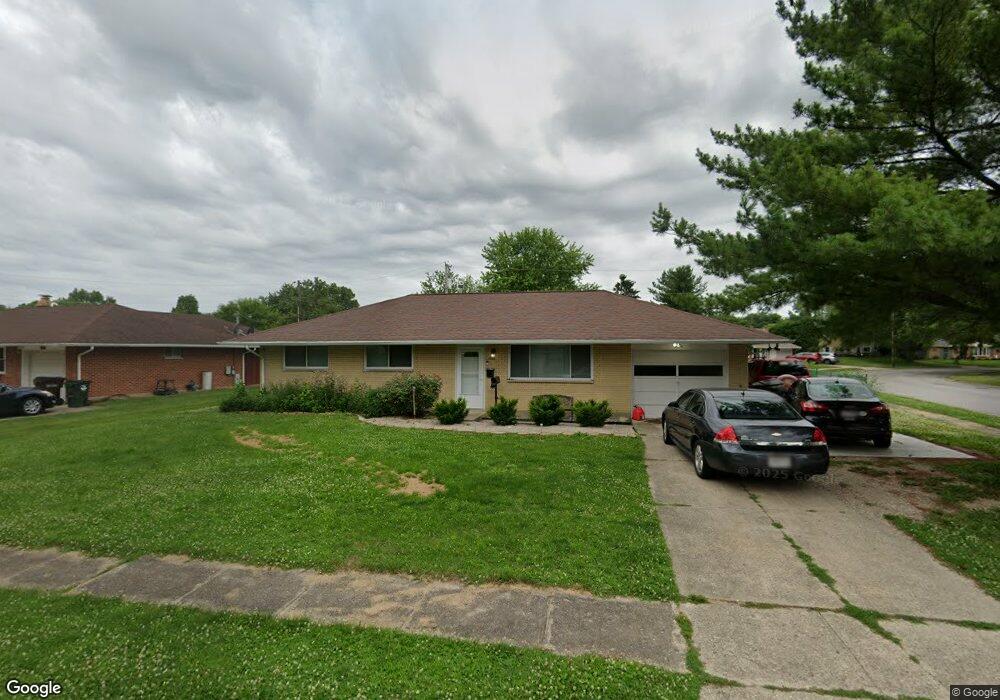
This home is located at 454 Redbud Ln, Xenia, OH 45385 and is currently estimated at $210,820, approximately $195 per square foot. 454 Redbud Ln is a home located in Greene County with nearby schools including Xenia High School, Summit Academy Community School for Alternative Learners - Xenia, and Legacy Christian Academy.
Ownership History
Date
Name
Owned For
Owner Type
Purchase Details
Closed on
May 19, 2016
Sold by
Stephanie L Wiza
Bought by
Stump Darcy and Stump Jack
Current Estimated Value
Home Financials for this Owner
Home Financials are based on the most recent Mortgage that was taken out on this home.
Original Mortgage
$98,188
Outstanding Balance
$77,747
Interest Rate
3.58%
Estimated Equity
$133,073
Purchase Details
Closed on
May 18, 2016
Bought by
Stump Jack B
Home Financials for this Owner
Home Financials are based on the most recent Mortgage that was taken out on this home.
Original Mortgage
$98,188
Outstanding Balance
$77,747
Interest Rate
3.58%
Estimated Equity
$133,073
Purchase Details
Closed on
Oct 2, 1997
Sold by
Griffis Thomas D
Bought by
Wiza Peter P and Wiza L
Home Financials for this Owner
Home Financials are based on the most recent Mortgage that was taken out on this home.
Original Mortgage
$89,845
Interest Rate
7.54%
Mortgage Type
FHA
Create a Home Valuation Report for This Property
The Home Valuation Report is an in-depth analysis detailing your home's value as well as a comparison with similar homes in the area
Home Values in the Area
Average Home Value in this Area
Purchase History
| Date | Buyer | Sale Price | Title Company |
|---|---|---|---|
| Stump Darcy | -- | -- | |
| Stump Jack B | $100,000 | -- | |
| Wiza Peter P | $89,900 | -- |
Source: Public Records
Mortgage History
| Date | Status | Borrower | Loan Amount |
|---|---|---|---|
| Open | Stump Jack B | $98,188 | |
| Closed | Stump Jack B | -- | |
| Closed | Stump Jack B | -- | |
| Previous Owner | Wiza Peter P | $89,845 |
Source: Public Records
Tax History Compared to Growth
Tax History
| Year | Tax Paid | Tax Assessment Tax Assessment Total Assessment is a certain percentage of the fair market value that is determined by local assessors to be the total taxable value of land and additions on the property. | Land | Improvement |
|---|---|---|---|---|
| 2024 | $2,246 | $53,870 | $10,040 | $43,830 |
| 2023 | $2,246 | $53,870 | $10,040 | $43,830 |
| 2022 | $1,925 | $39,370 | $6,270 | $33,100 |
| 2021 | $1,951 | $39,370 | $6,270 | $33,100 |
| 2020 | $1,868 | $39,370 | $6,270 | $33,100 |
| 2019 | $1,479 | $29,340 | $7,370 | $21,970 |
| 2018 | $1,484 | $29,340 | $7,370 | $21,970 |
| 2017 | $1,442 | $29,340 | $7,370 | $21,970 |
| 2016 | $1,442 | $27,990 | $7,370 | $20,620 |
| 2015 | $723 | $27,990 | $7,370 | $20,620 |
| 2014 | $1,384 | $27,990 | $7,370 | $20,620 |
Source: Public Records
Map
Nearby Homes
- 508 Marshall Dr
- 513 Redbud Ln
- 568 Louise Dr
- 610 Saxony Dr
- 479 N Stadium Dr
- 348 S Stadium Dr
- 656 Eden Roc Dr
- 119 Park Dr
- 659 N King St
- 878 N Detroit St
- 902 N Detroit St
- 516 N King St
- 645 E Church St
- 1038 Frederick Dr
- 612 E Market St
- 137 Pleasant St
- 613 N West St
- 1171 N Detroit St
- 541 E Main St
- 607 E Main St