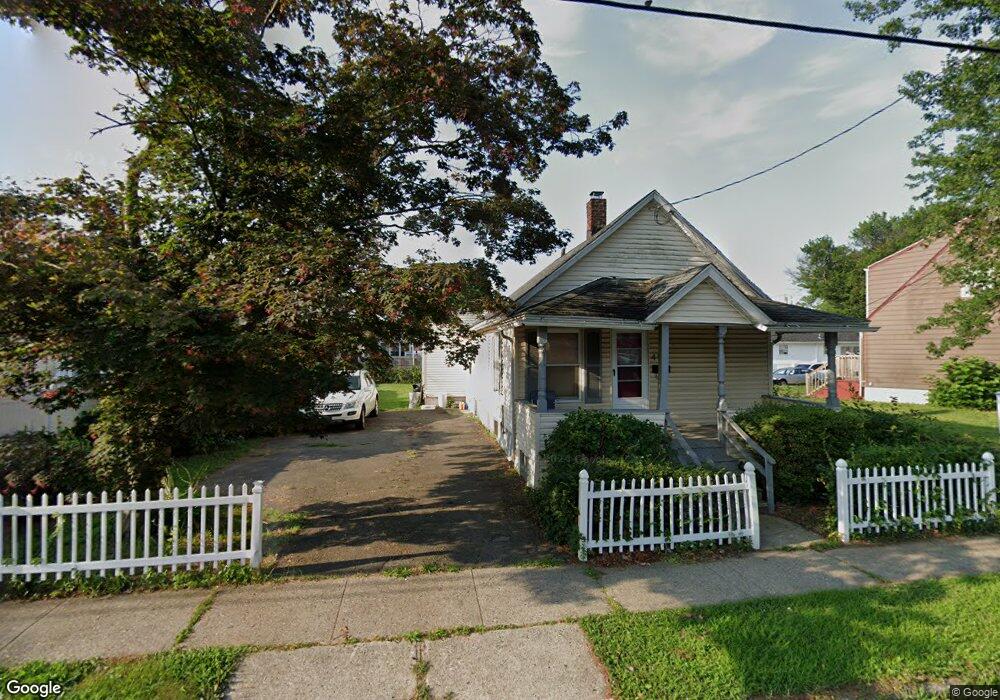
454 Sedgewick Ave Stratford, CT 06615
Stratford Center Historic District NeighborhoodEstimated Value: $280,000 - $314,000
3
Beds
1
Bath
1,032
Sq Ft
$290/Sq Ft
Est. Value
About This Home
This home is located at 454 Sedgewick Ave, Stratford, CT 06615 and is currently estimated at $299,677, approximately $290 per square foot. 454 Sedgewick Ave is a home located in Fairfield County with nearby schools including Stratford Academy - Johnson House, David Wooster Middle School, and Stratford High School.
Ownership History
Date
Name
Owned For
Owner Type
Purchase Details
Closed on
Apr 5, 2006
Sold by
Albert Matthew
Bought by
James Ponce
Current Estimated Value
Home Financials for this Owner
Home Financials are based on the most recent Mortgage that was taken out on this home.
Original Mortgage
$229,000
Outstanding Balance
$130,108
Interest Rate
6.26%
Estimated Equity
$169,569
Purchase Details
Closed on
May 20, 2005
Sold by
Millhouse Wesley
Bought by
Albert Matthew
Home Financials for this Owner
Home Financials are based on the most recent Mortgage that was taken out on this home.
Original Mortgage
$98,100
Interest Rate
5.62%
Purchase Details
Closed on
Aug 17, 2000
Sold by
Brown Andre A and Brown Marjorie
Bought by
Millhouse Wesley
Home Financials for this Owner
Home Financials are based on the most recent Mortgage that was taken out on this home.
Original Mortgage
$80,000
Interest Rate
11%
Create a Home Valuation Report for This Property
The Home Valuation Report is an in-depth analysis detailing your home's value as well as a comparison with similar homes in the area
Home Values in the Area
Average Home Value in this Area
Purchase History
| Date | Buyer | Sale Price | Title Company |
|---|---|---|---|
| James Ponce | $229,000 | -- | |
| Albert Matthew | $163,500 | -- | |
| Millhouse Wesley | $100,000 | -- |
Source: Public Records
Mortgage History
| Date | Status | Borrower | Loan Amount |
|---|---|---|---|
| Open | Millhouse Wesley | $229,000 | |
| Previous Owner | Millhouse Wesley | $98,100 | |
| Previous Owner | Millhouse Wesley | $120,000 | |
| Previous Owner | Millhouse Wesley | $80,000 |
Source: Public Records
Tax History
| Year | Tax Paid | Tax Assessment Tax Assessment Total Assessment is a certain percentage of the fair market value that is determined by local assessors to be the total taxable value of land and additions on the property. | Land | Improvement |
|---|---|---|---|---|
| 2025 | $3,852 | $95,830 | $49,070 | $46,760 |
| 2024 | $3,852 | $95,830 | $49,070 | $46,760 |
| 2023 | $3,852 | $95,830 | $49,070 | $46,760 |
| 2022 | $3,781 | $95,830 | $49,070 | $46,760 |
| 2021 | $3,782 | $95,830 | $49,070 | $46,760 |
| 2020 | $3,799 | $95,830 | $49,070 | $46,760 |
| 2019 | $3,653 | $91,630 | $40,810 | $50,820 |
| 2018 | $3,656 | $91,630 | $40,810 | $50,820 |
| 2017 | $3,662 | $91,630 | $40,810 | $50,820 |
| 2016 | $3,573 | $91,630 | $40,810 | $50,820 |
| 2015 | $3,388 | $91,630 | $40,810 | $50,820 |
| 2014 | $3,464 | $97,230 | $41,860 | $55,370 |
Source: Public Records
Map
Nearby Homes
- 425 Mckinley Ave
- 366 Columbus Ave
- 19 Wooster Ave
- 325 Mckinley Ave
- 120 Chelsea St
- 394 Harding Ave
- 33 Sands Place
- 265 Birdseye St
- 62 Roosevelt Ave
- 1462 South Ave
- 1260 Elm St
- 79 Evelyn St
- 15 Harding Ave
- 1596 Main St
- 50 Birdseye St Unit 104
- 25 Lindsley Place
- 1867 Main St
- 17 Miranda Ln
- 54 Vernon St
- 71 Oakland St
- 25 Yarwood St
- 35 Yarwood St
- 436 Sedgewick Ave
- 436 Sedgewick Ave Unit 2nd floor
- 22 General St
- 41 Yarwood St
- 36 General St
- 477 Sedgewick Ave Unit 2nd Floor
- 465 Sedgewick Ave
- 45 Yarwood St
- 28 Yarwood St
- 50 General St
- 36 Yarwood St
- 441 Sedgewick Ave
- 355 Everett St
- 55 Yarwood St
- 455 Sedgewick Ave
- 406 Sedgewick Ave
- 483 Sedgewick Ave
Your Personal Tour Guide
Ask me questions while you tour the home.