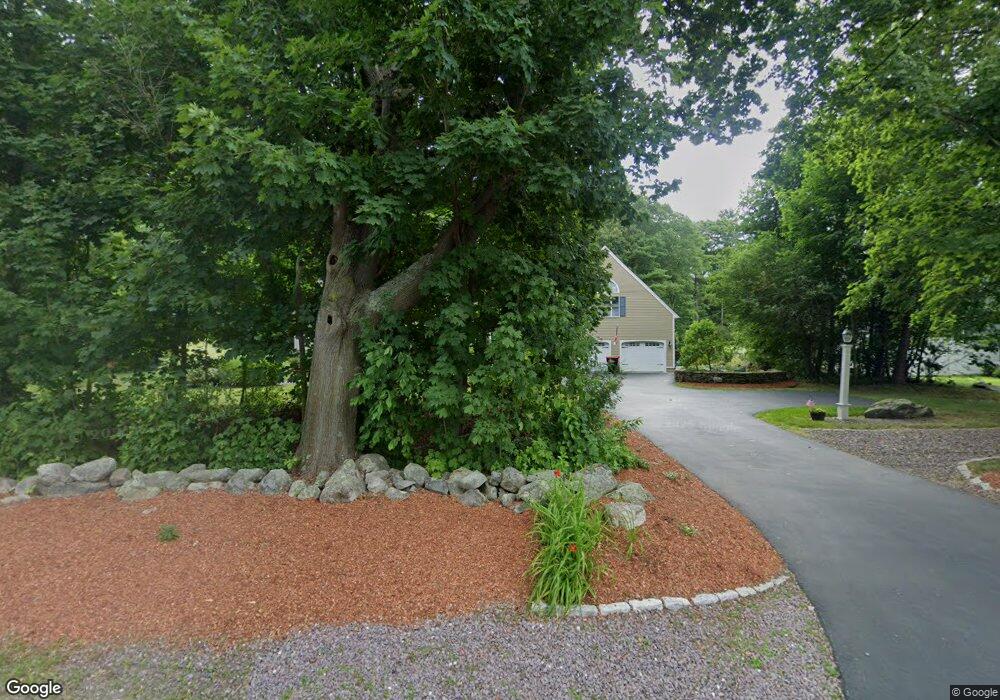
454 South St Foxboro, MA 02035
Estimated Value: $717,000 - $816,000
4
Beds
3
Baths
1,873
Sq Ft
$416/Sq Ft
Est. Value
About This Home
This home is located at 454 South St, Foxboro, MA 02035 and is currently estimated at $779,154, approximately $415 per square foot. 454 South St is a home located in Norfolk County with nearby schools including Foxborough High School, Foxborough Regional Charter School, and Hands-On-Montessori School.
Ownership History
Date
Name
Owned For
Owner Type
Purchase Details
Closed on
Jul 22, 2023
Sold by
Hardy John F and Hardy Elizabeth
Bought by
Harday Ft and Hardy
Current Estimated Value
Purchase Details
Closed on
May 8, 1981
Bought by
Hardy John F and Hardy Elizabeth
Create a Home Valuation Report for This Property
The Home Valuation Report is an in-depth analysis detailing your home's value as well as a comparison with similar homes in the area
Home Values in the Area
Average Home Value in this Area
Purchase History
| Date | Buyer | Sale Price | Title Company |
|---|---|---|---|
| Harday Ft | -- | None Available | |
| Hardy John F | -- | -- |
Source: Public Records
Mortgage History
| Date | Status | Borrower | Loan Amount |
|---|---|---|---|
| Previous Owner | Hardy John F | $150,000 | |
| Previous Owner | Hardy John F | $110,000 | |
| Previous Owner | Hardy John F | $110,000 |
Source: Public Records
Tax History Compared to Growth
Tax History
| Year | Tax Paid | Tax Assessment Tax Assessment Total Assessment is a certain percentage of the fair market value that is determined by local assessors to be the total taxable value of land and additions on the property. | Land | Improvement |
|---|---|---|---|---|
| 2025 | $10,235 | $774,200 | $243,400 | $530,800 |
| 2024 | $9,510 | $703,900 | $261,000 | $442,900 |
| 2023 | $9,219 | $648,800 | $249,000 | $399,800 |
| 2022 | $8,763 | $603,500 | $224,100 | $379,400 |
| 2021 | $8,085 | $548,500 | $213,200 | $335,300 |
| 2020 | $7,490 | $514,100 | $213,200 | $300,900 |
| 2019 | $7,538 | $512,800 | $213,700 | $299,100 |
| 2018 | $7,177 | $492,600 | $203,400 | $289,200 |
| 2017 | $7,573 | $503,500 | $200,100 | $303,400 |
| 2016 | $7,557 | $509,900 | $193,000 | $316,900 |
| 2015 | $7,106 | $467,800 | $145,500 | $322,300 |
| 2014 | $7,012 | $467,800 | $145,500 | $322,300 |
Source: Public Records
Map
Nearby Homes