454 Tower St Fall River, MA 02721
Maplewood NeighborhoodEstimated Value: $494,000 - $693,000
3
Beds
4
Baths
3,268
Sq Ft
$174/Sq Ft
Est. Value
About This Home
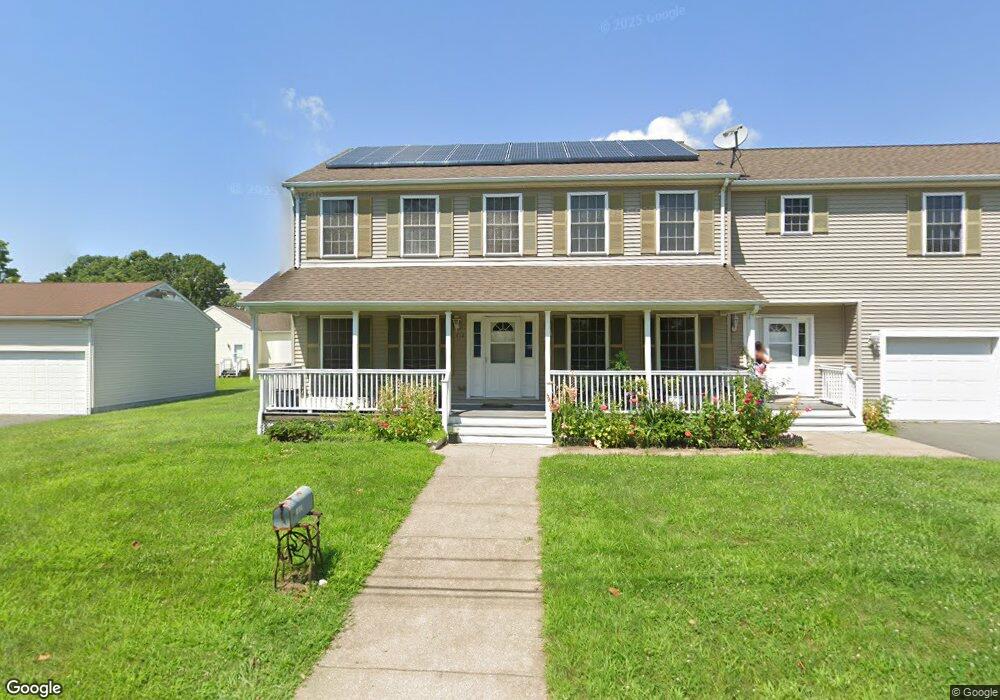
This home is located at 454 Tower St, Fall River, MA 02721 and is currently estimated at $568,845, approximately $174 per square foot. 454 Tower St is a home located in Bristol County with nearby schools including Letourneau Elementary School, Matthew J. Kuss Middle School, and B M C Durfee High School.
Ownership History
Date
Name
Owned For
Owner Type
Purchase Details
Closed on
Oct 26, 1999
Sold by
Ferreira Alvaro and Ferreira Albertina
Bought by
Wong Nelson A
Current Estimated Value
Home Financials for this Owner
Home Financials are based on the most recent Mortgage that was taken out on this home.
Original Mortgage
$80,000
Interest Rate
7.83%
Mortgage Type
Purchase Money Mortgage
Create a Home Valuation Report for This Property
The Home Valuation Report is an in-depth analysis detailing your home's value as well as a comparison with similar homes in the area
Home Values in the Area
Average Home Value in this Area
Purchase History
| Date | Buyer | Sale Price | Title Company |
|---|---|---|---|
| Wong Nelson A | $120,000 | -- |
Source: Public Records
Mortgage History
| Date | Status | Borrower | Loan Amount |
|---|---|---|---|
| Open | Wong Nelson A | $240,000 | |
| Closed | Wong Nelson A | $310,000 | |
| Closed | Wong Nelson A | $80,000 |
Source: Public Records
Tax History
| Year | Tax Paid | Tax Assessment Tax Assessment Total Assessment is a certain percentage of the fair market value that is determined by local assessors to be the total taxable value of land and additions on the property. | Land | Improvement |
|---|---|---|---|---|
| 2025 | $6,340 | $553,700 | $119,800 | $433,900 |
| 2024 | $5,941 | $517,100 | $117,500 | $399,600 |
| 2023 | $6,302 | $513,600 | $105,800 | $407,800 |
| 2022 | $5,237 | $442,500 | $99,900 | $342,600 |
| 2021 | $5,237 | $378,700 | $95,400 | $283,300 |
| 2020 | $5,154 | $356,700 | $91,000 | $265,700 |
| 2019 | $5,110 | $350,500 | $95,200 | $255,300 |
| 2018 | $4,939 | $337,800 | $95,900 | $241,900 |
| 2017 | $4,673 | $333,800 | $95,900 | $237,900 |
| 2016 | $4,412 | $323,700 | $98,800 | $224,900 |
| 2015 | $4,256 | $325,400 | $98,800 | $226,600 |
| 2014 | $4,094 | $325,400 | $98,800 | $226,600 |
Source: Public Records
Map
Nearby Homes
Your Personal Tour Guide
Ask me questions while you tour the home.