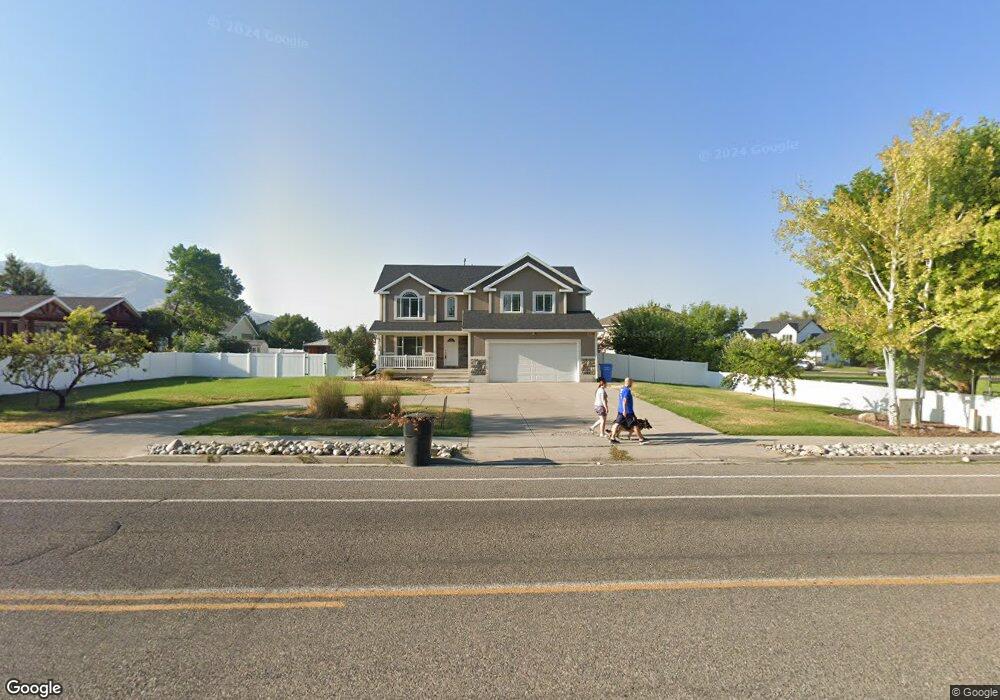
454 W 300 S Providence, UT 84332
Estimated Value: $650,000 - $694,000
7
Beds
4
Baths
3,469
Sq Ft
$195/Sq Ft
Est. Value
About This Home
This home is located at 454 W 300 S, Providence, UT 84332 and is currently estimated at $677,306, approximately $195 per square foot. 454 W 300 S is a home located in Cache County with nearby schools including River Heights School, Spring Creek Middle School, and South Cache Middle School.
Ownership History
Date
Name
Owned For
Owner Type
Purchase Details
Closed on
Oct 24, 2024
Sold by
Mcmurdie Justin Paul
Bought by
Mcmurdie Justin Paul and Mcmurdie Gaelin Janelle
Current Estimated Value
Home Financials for this Owner
Home Financials are based on the most recent Mortgage that was taken out on this home.
Original Mortgage
$550,320
Outstanding Balance
$543,250
Interest Rate
6.2%
Mortgage Type
New Conventional
Estimated Equity
$134,056
Purchase Details
Closed on
Jun 10, 2002
Sold by
Action Builders Llp
Bought by
Horizon Enterprises Inc
Create a Home Valuation Report for This Property
The Home Valuation Report is an in-depth analysis detailing your home's value as well as a comparison with similar homes in the area
Home Values in the Area
Average Home Value in this Area
Purchase History
| Date | Buyer | Sale Price | Title Company |
|---|---|---|---|
| Mcmurdie Justin Paul | -- | Pinnacle Title | |
| Mcmurdie Justin Paul | -- | Us Title | |
| Horizon Enterprises Inc | -- | Cache Title Company Inc |
Source: Public Records
Mortgage History
| Date | Status | Borrower | Loan Amount |
|---|---|---|---|
| Open | Mcmurdie Justin Paul | $550,320 |
Source: Public Records
Tax History Compared to Growth
Tax History
| Year | Tax Paid | Tax Assessment Tax Assessment Total Assessment is a certain percentage of the fair market value that is determined by local assessors to be the total taxable value of land and additions on the property. | Land | Improvement |
|---|---|---|---|---|
| 2025 | $2,689 | $376,925 | $0 | $0 |
| 2024 | $2,474 | $322,725 | $0 | $0 |
| 2023 | $2,621 | $322,065 | $0 | $0 |
| 2022 | $2,412 | $279,995 | $0 | $0 |
| 2021 | $2,365 | $420,560 | $66,500 | $354,060 |
| 2020 | $2,314 | $381,600 | $66,500 | $315,100 |
| 2019 | $2,444 | $381,600 | $66,500 | $315,100 |
| 2018 | $2,250 | $358,770 | $66,500 | $292,270 |
| 2017 | $2,100 | $177,210 | $0 | $0 |
| 2016 | $2,123 | $151,470 | $0 | $0 |
| 2015 | $1,680 | $139,860 | $0 | $0 |
| 2014 | $1,638 | $139,860 | $0 | $0 |
| 2013 | -- | $139,860 | $0 | $0 |
Source: Public Records
Map
Nearby Homes