Estimated Value: $1,060,000
3
Beds
1
Bath
1,710
Sq Ft
$620/Sq Ft
Est. Value
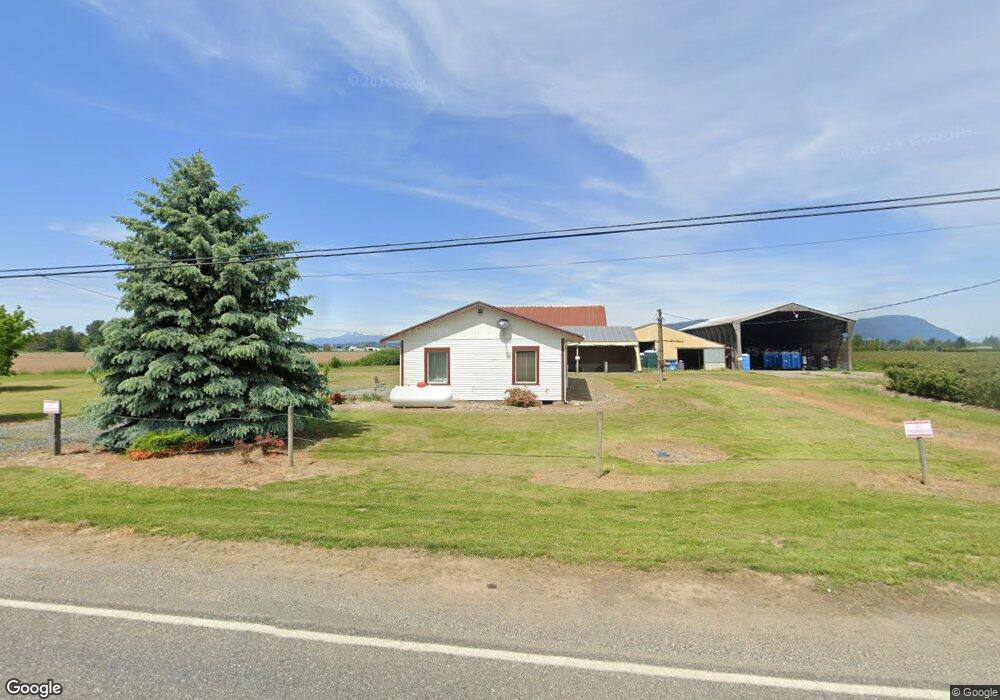
About This Home
This home is located at 4540 Rock Rd, Sumas, WA 98295 and is currently priced at $1,060,000, approximately $619 per square foot. 4540 Rock Rd is a home located in Whatcom County with nearby schools including Sumas Elementary School, Nooksack Elementary School, and Everson Elementary School.
Ownership History
Date
Name
Owned For
Owner Type
Purchase Details
Closed on
Dec 19, 2020
Sold by
Sarbanand Farms Llc
Bought by
Rock Road Sumas Wa Llc
Current Estimated Value
Purchase Details
Closed on
Jul 20, 2011
Sold by
Capital Company Inc
Bought by
Sarbanand Farms Llc
Purchase Details
Closed on
Mar 28, 2007
Sold by
Heutink Eldon D and Heutink Pamela J
Bought by
Capital Co Inc
Home Financials for this Owner
Home Financials are based on the most recent Mortgage that was taken out on this home.
Original Mortgage
$1,537,500
Interest Rate
6.29%
Mortgage Type
Purchase Money Mortgage
Create a Home Valuation Report for This Property
The Home Valuation Report is an in-depth analysis detailing your home's value as well as a comparison with similar homes in the area
Purchase History
| Date | Buyer | Sale Price | Title Company |
|---|---|---|---|
| Rock Road Sumas Wa Llc | -- | Fidelity National Ttl Ins Co | |
| Sarbanand Farms Llc | $13,934,000 | Chicago Title Insurance | |
| Capital Co Inc | $3,050,270 | Chicago Title Insurance |
Source: Public Records
Mortgage History
| Date | Status | Borrower | Loan Amount |
|---|---|---|---|
| Previous Owner | Capital Co Inc | $1,537,500 |
Source: Public Records
Tax History
| Year | Tax Paid | Tax Assessment Tax Assessment Total Assessment is a certain percentage of the fair market value that is determined by local assessors to be the total taxable value of land and additions on the property. | Land | Improvement |
|---|---|---|---|---|
| 2025 | $5,043 | $1,175,621 | $843,315 | $332,306 |
| 2024 | $4,534 | $1,159,165 | $834,965 | $324,200 |
| 2023 | $4,534 | $830,325 | $533,459 | $296,866 |
| 2022 | $3,847 | $748,053 | $480,602 | $267,451 |
| 2021 | $3,782 | $584,403 | $375,462 | $208,941 |
| 2020 | $3,421 | $188,669 | $11,600 | $177,069 |
| 2019 | $3,047 | $447,056 | $287,220 | $159,836 |
| 2018 | $3,956 | $162,646 | $10,000 | $152,646 |
| 2017 | $3,589 | $162,469 | $11,920 | $150,549 |
| 2016 | $3,576 | $144,751 | $10,620 | $134,131 |
| 2015 | $3,042 | $144,751 | $10,620 | $134,131 |
| 2014 | -- | $226,925 | $100,499 | $126,426 |
| 2013 | -- | $217,739 | $93,333 | $124,406 |
Source: Public Records
Map
Nearby Homes
- 4355 Jones Rd
- 1305 Boon St Unit 209
- 1305 Boon St Unit 213
- 235 Morton St
- 517 Lawson St
- 1116 Sumas Ave Unit 1
- 1116 Sumas Ave Unit 2
- 226 Morton St
- 310 Second St
- 208 Harrison St
- 125 Ridgeview St
- 9295 N Telegraph Rd
- 5326 Reese Hill Rd
- 5450 Reese Hill Rd
- 4135 Kamphouse Dr
- 5615 S Pass Rd
- 9088 Kendall Rd
- 8388 N Pass Rd
- 8146 Watkins Rd
- 0 Clearbrook Rd
Your Personal Tour Guide
Ask me questions while you tour the home.