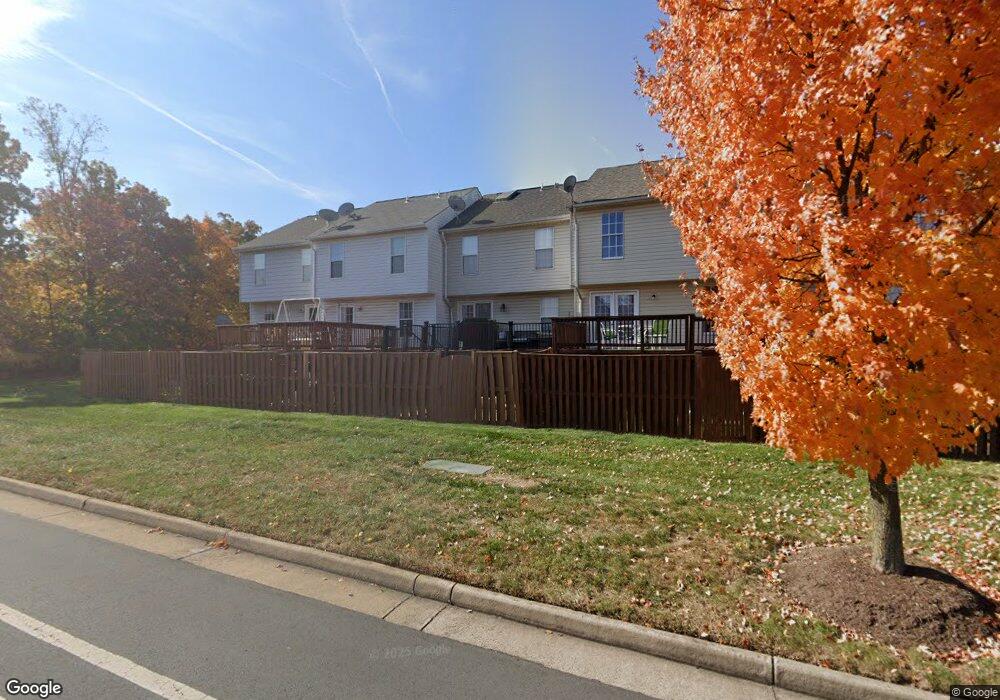
45404 Gable Square Sterling, VA 20164
Estimated Value: $475,902 - $518,000
4
Beds
4
Baths
1,160
Sq Ft
$431/Sq Ft
Est. Value
About This Home
This home is located at 45404 Gable Square, Sterling, VA 20164 and is currently estimated at $499,976, approximately $431 per square foot. 45404 Gable Square is a home located in Loudoun County with nearby schools including Guilford Elementary School, Sterling Middle School, and Park View High School.
Ownership History
Date
Name
Owned For
Owner Type
Purchase Details
Closed on
Jun 15, 2011
Sold by
Ghumman Qamer
Bought by
Frantum Todd D
Current Estimated Value
Home Financials for this Owner
Home Financials are based on the most recent Mortgage that was taken out on this home.
Original Mortgage
$252,200
Outstanding Balance
$174,756
Interest Rate
4.74%
Mortgage Type
New Conventional
Estimated Equity
$325,220
Purchase Details
Closed on
Mar 25, 2011
Sold by
Recontrust Company Na Tr
Bought by
Ghumman Qamer
Purchase Details
Closed on
Oct 25, 2005
Sold by
Ramos Walter
Bought by
Dellopes Anan and Lopez,Jose
Home Financials for this Owner
Home Financials are based on the most recent Mortgage that was taken out on this home.
Original Mortgage
$283,500
Interest Rate
5.79%
Mortgage Type
New Conventional
Purchase Details
Closed on
Jun 29, 1994
Sold by
Grp Ryland
Bought by
Tran M L
Home Financials for this Owner
Home Financials are based on the most recent Mortgage that was taken out on this home.
Original Mortgage
$119,428
Interest Rate
8.55%
Create a Home Valuation Report for This Property
The Home Valuation Report is an in-depth analysis detailing your home's value as well as a comparison with similar homes in the area
Home Values in the Area
Average Home Value in this Area
Purchase History
| Date | Buyer | Sale Price | Title Company |
|---|---|---|---|
| Frantum Todd D | $260,000 | -- | |
| Ghumman Qamer | $209,251 | -- | |
| Dellopes Anan | $405,000 | -- | |
| Tran M L | $120,073 | -- |
Source: Public Records
Mortgage History
| Date | Status | Borrower | Loan Amount |
|---|---|---|---|
| Open | Frantum Todd D | $252,200 | |
| Previous Owner | Dellopes Anan | $283,500 | |
| Previous Owner | Tran M L | $119,428 |
Source: Public Records
Tax History
| Year | Tax Paid | Tax Assessment Tax Assessment Total Assessment is a certain percentage of the fair market value that is determined by local assessors to be the total taxable value of land and additions on the property. | Land | Improvement |
|---|---|---|---|---|
| 2025 | $3,833 | $476,170 | $165,000 | $311,170 |
| 2024 | $3,780 | $437,030 | $160,000 | $277,030 |
| 2023 | $3,726 | $425,830 | $160,000 | $265,830 |
| 2022 | $3,658 | $410,970 | $155,000 | $255,970 |
| 2021 | $3,581 | $365,420 | $130,000 | $235,420 |
| 2020 | $3,721 | $359,470 | $115,000 | $244,470 |
| 2019 | $3,524 | $337,190 | $100,000 | $237,190 |
| 2018 | $3,479 | $320,690 | $100,000 | $220,690 |
| 2017 | $3,510 | $312,020 | $100,000 | $212,020 |
| 2016 | $3,578 | $312,500 | $0 | $0 |
| 2015 | $3,542 | $212,050 | $0 | $212,050 |
| 2014 | $3,572 | $209,280 | $0 | $209,280 |
Source: Public Records
Map
Nearby Homes
- 45458 Oak Trail Square
- 46270 Mount Allen Terrace Unit 300
- 21630 Hawksbill High Cir Unit 204
- 21630 Hawksbill High Cir Unit 403
- 1021A Brixton Ct
- 1032B Margate Ct
- 1014 Ruritan Cir
- 1023 Margate Ct
- 1043 Margate Ct Unit 1043A
- 709 W Poplar Rd
- 22078 Manning Square
- 45544 Whitcomb Square
- 920 Windsor Ct
- 21946 Thompson Square
- 801 S Hoga St
- 45448 Baggett Terrace
- 203 W Poplar Rd
- 200 Williamsburg Rd
- 117 W Concord Ct
- 45745 Winding Branch Terrace
- 45402 Gable Square
- 45406 Gable Square
- 45400 Gable Square
- 45408 Gable Square
- 45398 Gable Square
- 45412 Gable Square
- 45414 Gable Square
- 45416 Gable Square
- 45418 Gable Square
- 45478 Pine Trail Terrace
- 45421 Gable Square
- 45420 Gable Square
- 22211 Great Trail Terrace
- 45423 Gable Square
- 45422 Gable Square
- 45480 Pine Trail Terrace
- 45424 Gable Square
- 45425 Gable Square
- 22213 Great Trail Terrace
- 45482 Pine Trail Terrace
Your Personal Tour Guide
Ask me questions while you tour the home.