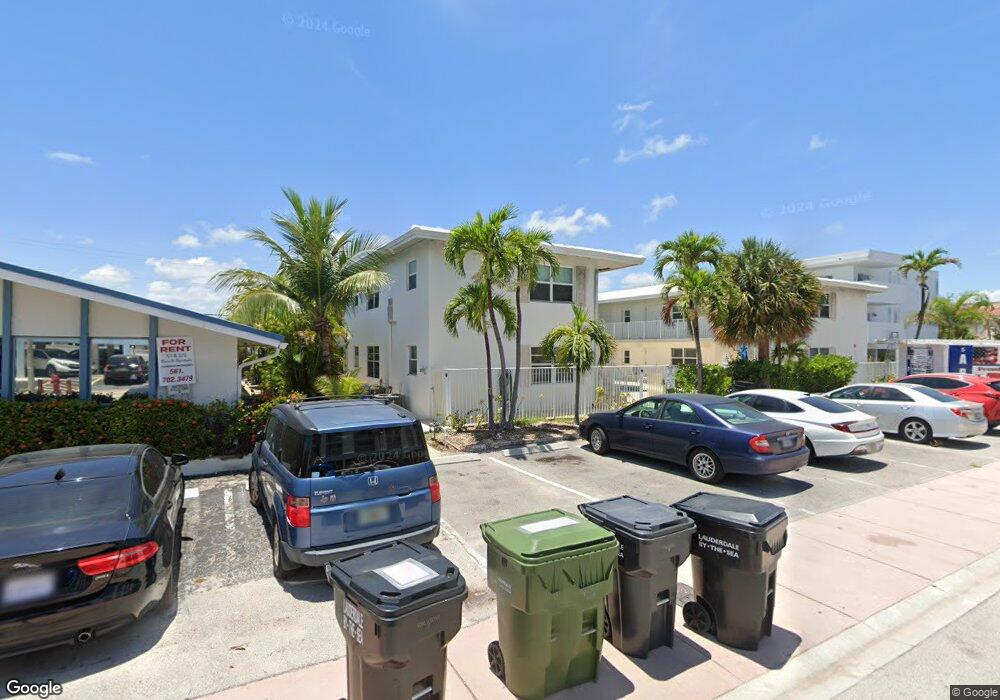
4541 N Ocean Dr Unit 1 Lauderdale By the Sea, FL 33308
Estimated Value: $209,000 - $384,000
2
Beds
1
Bath
640
Sq Ft
$417/Sq Ft
Est. Value
About This Home
This home is located at 4541 N Ocean Dr Unit 1, Lauderdale By the Sea, FL 33308 and is currently estimated at $266,759, approximately $416 per square foot. 4541 N Ocean Dr Unit 1 is a home located in Broward County with nearby schools including McNab Elementary School, Pompano Beach Middle School, and Northeast High School.
Ownership History
Date
Name
Owned For
Owner Type
Purchase Details
Closed on
Jun 25, 2025
Sold by
4541 North Ocean Drive Realty Trust and Santarpio Carla
Bought by
Melanson Alanna
Current Estimated Value
Home Financials for this Owner
Home Financials are based on the most recent Mortgage that was taken out on this home.
Original Mortgage
$160,000
Interest Rate
6.67%
Mortgage Type
New Conventional
Purchase Details
Closed on
Oct 26, 2018
Sold by
Pappas Corinne
Bought by
Santarpio Carla and 4541 North Ocean Drive Realty
Purchase Details
Closed on
Oct 19, 1999
Sold by
Degennaro Elaine A and Degennaro Philip
Bought by
Pappas Corinne
Purchase Details
Closed on
Jun 10, 1997
Sold by
Mattina Joseph J
Bought by
Digennaro Elaine A
Purchase Details
Closed on
Aug 3, 1982
Sold by
Available Not
Bought by
Available Not
Purchase Details
Closed on
Jun 1, 1982
Sold by
Available Not
Bought by
Available Not
Create a Home Valuation Report for This Property
The Home Valuation Report is an in-depth analysis detailing your home's value as well as a comparison with similar homes in the area
Home Values in the Area
Average Home Value in this Area
Purchase History
| Date | Buyer | Sale Price | Title Company |
|---|---|---|---|
| Melanson Alanna | $200,000 | Consumers First Title | |
| Santarpio Carla | $140,000 | Attorney | |
| Pappas Corinne | $76,000 | -- | |
| Digennaro Elaine A | $100 | -- | |
| Available Not | $10,000 | -- | |
| Available Not | $32,143 | -- |
Source: Public Records
Mortgage History
| Date | Status | Borrower | Loan Amount |
|---|---|---|---|
| Previous Owner | Melanson Alanna | $160,000 |
Source: Public Records
Tax History Compared to Growth
Tax History
| Year | Tax Paid | Tax Assessment Tax Assessment Total Assessment is a certain percentage of the fair market value that is determined by local assessors to be the total taxable value of land and additions on the property. | Land | Improvement |
|---|---|---|---|---|
| 2025 | $3,892 | $202,480 | -- | -- |
| 2024 | $3,357 | $202,480 | -- | -- |
| 2023 | $3,357 | $167,350 | $0 | $0 |
| 2022 | $2,874 | $152,140 | $0 | $0 |
| 2021 | $2,572 | $138,310 | $13,830 | $124,480 |
| 2020 | $2,590 | $139,320 | $13,930 | $125,390 |
| 2019 | $2,379 | $126,080 | $12,610 | $113,470 |
| 2018 | $2,193 | $119,410 | $11,940 | $107,470 |
| 2017 | $2,116 | $104,890 | $0 | $0 |
| 2016 | $1,898 | $95,360 | $0 | $0 |
| 2015 | $2,077 | $102,070 | $0 | $0 |
| 2014 | $1,981 | $94,820 | $0 | $0 |
| 2013 | -- | $86,200 | $8,620 | $77,580 |
Source: Public Records
Map
Nearby Homes
- 4549 N Ocean Dr Unit 1
- 4540 N Ocean Dr Unit 104
- 4540 N Ocean Dr Unit 406
- 4540 N Ocean Dr Unit 506
- 4548 N Ocean Dr
- 4520 El Mar Dr Unit 2
- 4525 Poinciana St Unit 1
- 4511 El Mar Dr Unit 202
- 4510 El Mar Dr Unit 405
- 4524 Sea Grape Dr Unit 1
- 4524 Sea Grape Dr Unit 2 South
- 4512 Sea Grape Dr
- 4445 El Mar Dr Unit 2306
- 4445 El Mar Dr Unit 2209
- 4445 El Mar Dr Unit 2314
- 4433 Poinciana St
- 4444 El Mar Dr Unit 3302
- 4629 Poinciana St Unit 215
- 4629 Poinciana St Unit 204
- 4629 Poinciana St Unit 211
- 4541 N Ocean Dr Unit 7
- 4541 N Ocean Dr Unit 3
- 4541 N Ocean Dr Unit 6
- 4541 N Ocean Dr Unit 8
- 4541 N Ocean Dr Unit 10
- 4541 N Ocean Dr Unit 5
- 4541 N Ocean Dr Unit 11
- 4541 N Ocean Dr Unit 4
- 4541 N Ocean Dr Unit 2
- 4533 N Ocean Dr
- 4549 N Ocean Dr Unit 2
- 4549 N Ocean Dr Unit 5
- 4549 N Ocean Dr Unit 4
- 4549 N Ocean Dr Unit 3
- 4540 Bougainvilla Dr Unit 9
- 4540 Bougainvilla Dr Unit 8
- 4540 Bougainvilla Dr Unit 4
- 4540 Bougainvilla Dr Unit 3
- 4540 Bougainvilla Dr Unit 2
- 4540 Bougainvilla Dr Unit 5