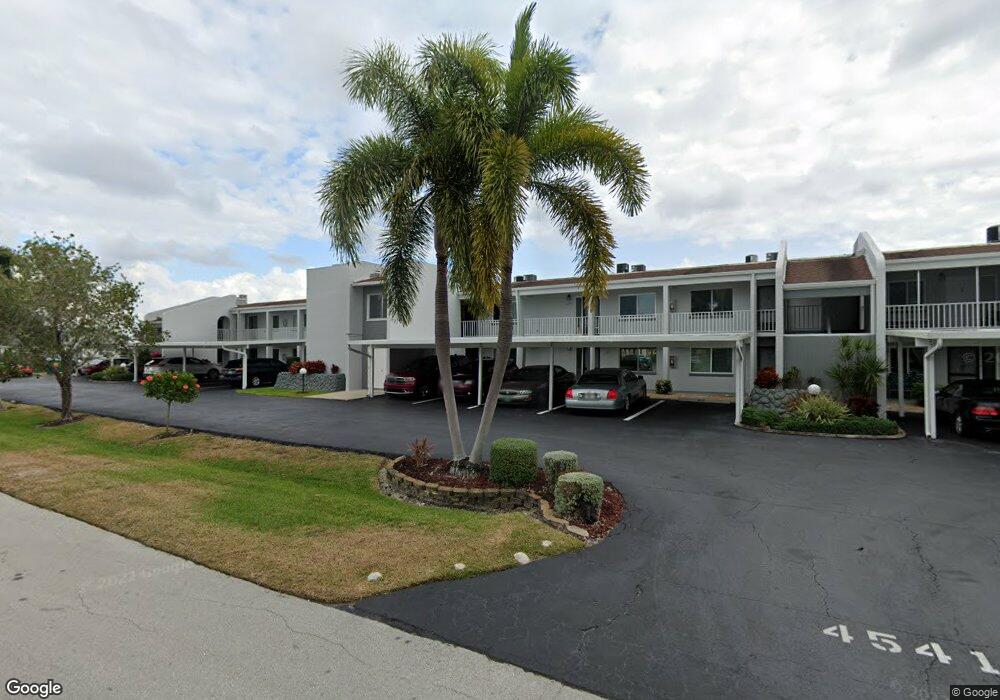
4541 SE 5th Place Unit 102 Cape Coral, FL 33904
Caloosahatchee NeighborhoodEstimated Value: $174,000 - $212,000
2
Beds
2
Baths
1,019
Sq Ft
$190/Sq Ft
Est. Value
About This Home
This home is located at 4541 SE 5th Place Unit 102, Cape Coral, FL 33904 and is currently estimated at $193,765, approximately $190 per square foot. 4541 SE 5th Place Unit 102 is a home located in Lee County with nearby schools including Cape Elementary School, Caloosa Elementary School, and Hancock Creek Elementary School.
Ownership History
Date
Name
Owned For
Owner Type
Purchase Details
Closed on
Oct 24, 2023
Sold by
Gaertner Mark H and Gaertner Susan C
Bought by
Gaertner Mark H and Gaertner Susan C
Current Estimated Value
Purchase Details
Closed on
Apr 17, 2015
Sold by
Hartung Beverly C and Macarthur Gail
Bought by
Gaertner Mark and Gaertner Susan
Home Financials for this Owner
Home Financials are based on the most recent Mortgage that was taken out on this home.
Original Mortgage
$73,000
Interest Rate
3.84%
Mortgage Type
Seller Take Back
Purchase Details
Closed on
Oct 19, 2005
Sold by
Hartung Beverly C
Bought by
Hartung Beverly C and Paul A & Beverly C Hartung Revocable Tr
Purchase Details
Closed on
Aug 27, 2002
Sold by
Weaver Milton F and Weaver Florence A
Bought by
Hartung Paul A and Hartung Beverly A
Create a Home Valuation Report for This Property
The Home Valuation Report is an in-depth analysis detailing your home's value as well as a comparison with similar homes in the area
Home Values in the Area
Average Home Value in this Area
Purchase History
| Date | Buyer | Sale Price | Title Company |
|---|---|---|---|
| Gaertner Mark H | $100 | None Listed On Document | |
| Gaertner Mark | $76,300 | Attorney | |
| Hartung Beverly C | -- | None Available | |
| Hartung Paul A | $100,000 | -- |
Source: Public Records
Mortgage History
| Date | Status | Borrower | Loan Amount |
|---|---|---|---|
| Previous Owner | Gaertner Mark | $73,000 |
Source: Public Records
Tax History Compared to Growth
Tax History
| Year | Tax Paid | Tax Assessment Tax Assessment Total Assessment is a certain percentage of the fair market value that is determined by local assessors to be the total taxable value of land and additions on the property. | Land | Improvement |
|---|---|---|---|---|
| 2025 | $2,947 | $152,159 | -- | -- |
| 2024 | $3,154 | $138,326 | -- | -- |
| 2023 | $3,154 | $125,751 | $0 | $0 |
| 2022 | $2,535 | $114,319 | $0 | $0 |
| 2021 | $2,179 | $118,166 | $0 | $118,166 |
| 2020 | $1,977 | $94,478 | $0 | $94,478 |
| 2019 | $1,965 | $94,478 | $0 | $94,478 |
| 2018 | $2,016 | $95,285 | $0 | $95,285 |
| 2017 | $2,061 | $98,515 | $0 | $98,515 |
| 2016 | $1,890 | $86,996 | $0 | $86,996 |
| 2015 | $414 | $75,700 | $0 | $75,700 |
| 2014 | $347 | $72,200 | $0 | $72,200 |
| 2013 | -- | $62,800 | $0 | $62,800 |
Source: Public Records
Map
Nearby Homes
- 4541 SE 5th Place Unit 207
- 4521 SE 5th Place
- 4549 SE 5th Place Unit 211
- 4538 SE 6th Ct
- 4538 SE 5th Place Unit 3
- 4507 SE 5th Place
- 4550 SE 5th Place Unit 202
- 4563 SE 5th Place Unit 205
- 4500 SE 5th Place Unit 105
- 4518 SE 6th Ct
- 4411 Country Club Blvd Unit A1
- 4411 Country Club Blvd Unit A2
- 4417 Country Club Blvd Unit B6
- 4611 SE 5th Place Unit 8
- 4608 SE 6th Ave Unit 1D
- 4610 SE 5th Place Unit 201
- 4515 Country Club Blvd Unit 103
- 4515 Country Club Blvd Unit 204
- 4629 SE 5th Place Unit 12
- 4218 SE 6th Place
- 4541 SE 5th Place Unit 105
- 4541 SE 5th Place Unit 202
- 4541 SE 5th Place Unit 204
- 4541 SE 5th Place Unit 106
- 4541 SE 5th Place Unit 208
- 4541 SE 5th Place Unit 101
- 4541 SE 5th Place Unit 203
- 4541 SE 5th Place Unit 103
- 4541 SE 5th Place Unit 205
- 4541 SE 5th Place Unit 108
- 4541 SE 5th Place Unit 107
- 4541 SE 5th Place Unit 206
- 4541 SE 5th Place Unit 201
- 4541 SE 5th Place Unit 104
- 4546 SE 5th Place
- 4520 SE 6th Place Unit 2A
- 4520 SE 6th Place Unit 1B
- 4520 SE 6th Place Unit 1A
- 4520 SE 6th Place Unit 2B
- 4516 SE 6th Place Unit 2C