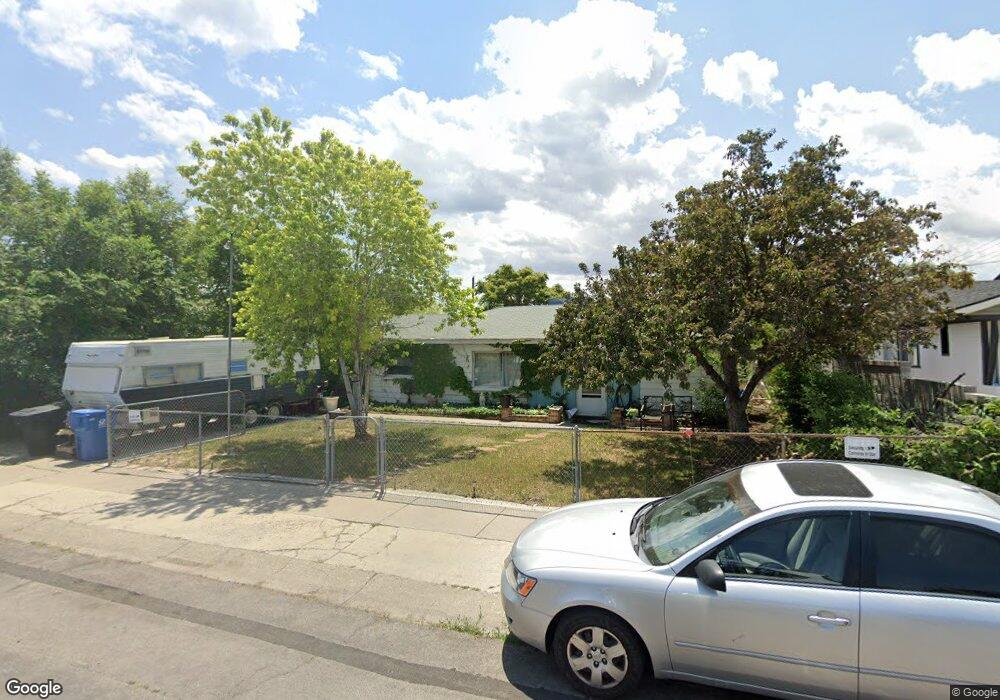
4541 W 4895 S Salt Lake City, UT 84118
Estimated Value: $367,000 - $406,000
3
Beds
2
Baths
1,440
Sq Ft
$272/Sq Ft
Est. Value
About This Home
This home is located at 4541 W 4895 S, Salt Lake City, UT 84118 and is currently estimated at $391,739, approximately $272 per square foot. 4541 W 4895 S is a home located in Salt Lake County with nearby schools including West Kearns Elementary School, Kearns Jr High School, and Kearns High School.
Ownership History
Date
Name
Owned For
Owner Type
Purchase Details
Closed on
Aug 19, 2022
Sold by
Marie Murdock Peggy
Bought by
Peggy Marie Murdock Living Trust
Current Estimated Value
Purchase Details
Closed on
Aug 5, 2019
Sold by
Murdock Peggy M and Murdock Peggy
Bought by
Murdock Peggy M
Home Financials for this Owner
Home Financials are based on the most recent Mortgage that was taken out on this home.
Original Mortgage
$183,150
Interest Rate
3.7%
Mortgage Type
FHA
Purchase Details
Closed on
Jul 22, 2005
Sold by
Niewinski John F and Niewinski Joanne
Bought by
Murdock Virgil B and Murdock Peggy
Home Financials for this Owner
Home Financials are based on the most recent Mortgage that was taken out on this home.
Original Mortgage
$119,900
Interest Rate
7.05%
Mortgage Type
Fannie Mae Freddie Mac
Purchase Details
Closed on
Mar 8, 2004
Sold by
Niewinski Joanne
Bought by
Niewinski John F and Niewinski Joanne
Create a Home Valuation Report for This Property
The Home Valuation Report is an in-depth analysis detailing your home's value as well as a comparison with similar homes in the area
Home Values in the Area
Average Home Value in this Area
Purchase History
| Date | Buyer | Sale Price | Title Company |
|---|---|---|---|
| Peggy Marie Murdock Living Trust | -- | None Listed On Document | |
| Murdock Peggy M | -- | Advantage Title Llc | |
| Murdock Virgil B | -- | United Title Services | |
| Niewinski John F | -- | -- |
Source: Public Records
Mortgage History
| Date | Status | Borrower | Loan Amount |
|---|---|---|---|
| Previous Owner | Murdock Peggy M | $183,150 | |
| Previous Owner | Murdock Virgil B | $119,900 |
Source: Public Records
Tax History Compared to Growth
Tax History
| Year | Tax Paid | Tax Assessment Tax Assessment Total Assessment is a certain percentage of the fair market value that is determined by local assessors to be the total taxable value of land and additions on the property. | Land | Improvement |
|---|---|---|---|---|
| 2025 | $2,272 | $314,100 | $97,300 | $216,800 |
| 2024 | $2,272 | $297,400 | $91,400 | $206,000 |
| 2023 | $2,278 | $270,600 | $87,900 | $182,700 |
| 2022 | $2,245 | $283,400 | $86,200 | $197,200 |
| 2021 | $2,020 | $236,100 | $66,300 | $169,800 |
| 2020 | $1,870 | $204,000 | $60,400 | $143,600 |
| 2019 | $1,806 | $200,800 | $57,000 | $143,800 |
| 2018 | $1,903 | $188,400 | $57,000 | $131,400 |
| 2017 | $1,449 | $162,700 | $57,000 | $105,700 |
| 2016 | $1,209 | $136,000 | $52,500 | $83,500 |
| 2015 | $1,142 | $119,600 | $64,100 | $55,500 |
| 2014 | $1,063 | $108,900 | $59,500 | $49,400 |
Source: Public Records
Map
Nearby Homes
- 4585 W 4895 S
- 4824 S 4520 W
- 4784 S 4520 W
- 4490 W 5055 S
- 4843 S 4720 W
- 4731 W 4955 S
- 4350 W 4835 S
- 4522 W 5100 S
- 5071 S 4420 W
- 4775 S 4380 W
- 4376 W 5055 S
- 4587 W 5100 S
- 5091 S 4460 W
- 4756 W 5055 S
- 4775 W 5100 S
- 4673 Carnegie Tech St
- 4644 S Carnegie Tech St Unit 4
- 4330 W 5215 S
- 4911 S 4980 W
- 4612 S Carnegie Tech St