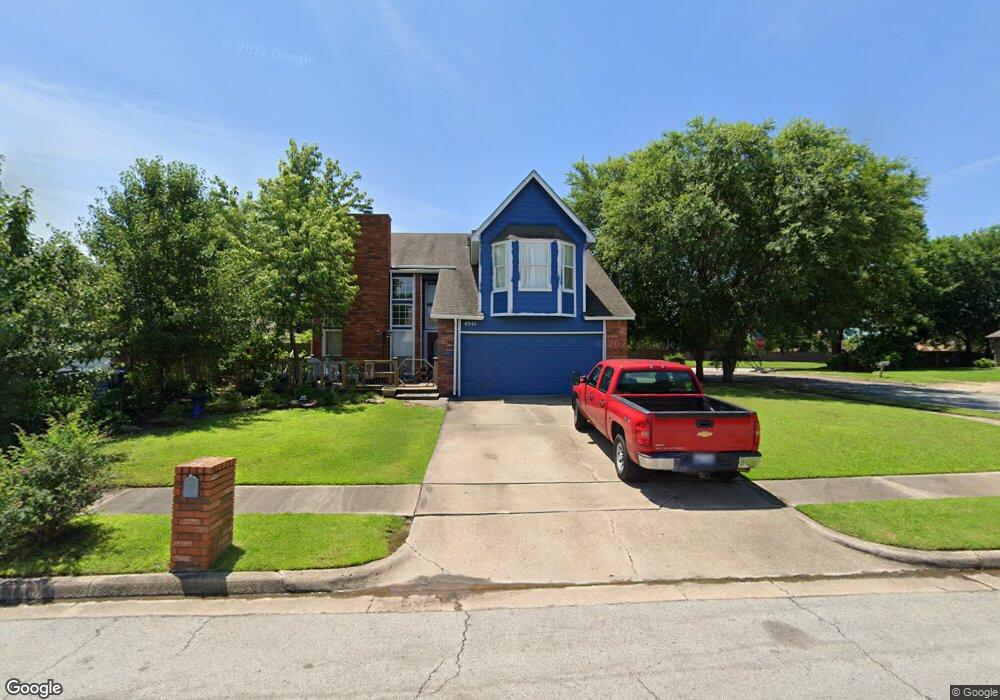
4541 W Lansing St Broken Arrow, OK 74012
Southbrook NeighborhoodEstimated Value: $238,000 - $285,000
--
Bed
2
Baths
2,114
Sq Ft
$124/Sq Ft
Est. Value
About This Home
This home is located at 4541 W Lansing St, Broken Arrow, OK 74012 and is currently estimated at $262,417, approximately $124 per square foot. 4541 W Lansing St is a home located in Tulsa County with nearby schools including Marshall T. Moore Elementary School, Union 8th Grade Center, and Union 6th-7th Grade Center.
Ownership History
Date
Name
Owned For
Owner Type
Purchase Details
Closed on
Jun 23, 2025
Sold by
Smith Rickey E and Smith Anita L
Bought by
Rickey And Anita Smith Family Trust and Smith
Current Estimated Value
Purchase Details
Closed on
Sep 13, 2005
Sold by
Evans Darrell and Evans Janice M
Bought by
Smith Rickey E and Smith Anita L
Home Financials for this Owner
Home Financials are based on the most recent Mortgage that was taken out on this home.
Original Mortgage
$96,000
Interest Rate
5.76%
Mortgage Type
Fannie Mae Freddie Mac
Purchase Details
Closed on
Mar 1, 1992
Create a Home Valuation Report for This Property
The Home Valuation Report is an in-depth analysis detailing your home's value as well as a comparison with similar homes in the area
Home Values in the Area
Average Home Value in this Area
Purchase History
| Date | Buyer | Sale Price | Title Company |
|---|---|---|---|
| Rickey And Anita Smith Family Trust | -- | None Listed On Document | |
| Smith Rickey E | $129,000 | Tulsa Abstract & Title Co | |
| -- | $78,000 | -- |
Source: Public Records
Mortgage History
| Date | Status | Borrower | Loan Amount |
|---|---|---|---|
| Previous Owner | Smith Rickey E | $96,000 |
Source: Public Records
Tax History Compared to Growth
Tax History
| Year | Tax Paid | Tax Assessment Tax Assessment Total Assessment is a certain percentage of the fair market value that is determined by local assessors to be the total taxable value of land and additions on the property. | Land | Improvement |
|---|---|---|---|---|
| 2024 | $2,253 | $18,329 | $2,509 | $15,820 |
| 2023 | $2,253 | $17,456 | $2,289 | $15,167 |
| 2022 | $2,163 | $16,625 | $3,285 | $13,340 |
| 2021 | $2,067 | $15,833 | $3,129 | $12,704 |
| 2020 | $2,081 | $15,833 | $3,129 | $12,704 |
| 2019 | $2,077 | $15,833 | $3,129 | $12,704 |
| 2018 | $1,980 | $15,137 | $2,991 | $12,146 |
| 2017 | $1,911 | $14,417 | $2,849 | $11,568 |
| 2016 | $1,856 | $14,190 | $2,849 | $11,341 |
| 2015 | $1,857 | $14,190 | $2,849 | $11,341 |
| 2014 | $1,846 | $14,190 | $2,849 | $11,341 |
Source: Public Records
Map
Nearby Homes
- 910 N Butternut Ct
- 905 N Butternut Ave
- 1109 N Cypress Ave
- 4501 W Hartford St
- 4419 W Madison St
- 708 N Aster Ave
- 2416 W Lansing Place
- 4429 W Norman St
- 4400 W Freeport Cir
- 4408 W Elgin St
- 1312 N Willow Ave
- 6727 S 112th East Ave
- 1429 N Yellowood Ave
- 4441 W Queens St
- 4201 W Detroit St
- 10942 E 76th St
- 10623 E 74th St
- 11033 E 66th St
- 4932 W Commercial St
- 6514 E 74th St S
- 4537 W Lansing St
- 4533 W Lansing St
- 1000 N Cypress Ave
- 1101 N Cypress Ave
- 1004 N Cypress Ave
- 1100 N Cypress Ave
- 4529 W Lansing St
- 4524 W Lansing St
- 1105 N Cypress Ave
- 1104 N Cypress Ave
- 911 N Butternut Ct
- 4520 W Lansing St
- 4525 W Lansing St
- 4516 W Lansing St
- 912 N Butternut Ave
- 907 N Butternut Ct
- 4521 W Lansing St
- 4519 W Lansing Place
- 4523 W Lansing Place
- 1113 N Cypress Ave
